
Displaying the error log view and managing log files
Talend Studio provides you with very comprehensive log files that maintain diagnostic information and record any errors that are encountered in the data profiling process.
The Error Log view is the first place to look when a problem occurs while profiling data, since it will often contain details of what went wrong and how to correct it.
Procedure
-
Perform one of the following steps:
- Press the Alt+Shift+Q and then L shortcut keys, or,
- Select from the menu bar.
The Show View dialog box opens.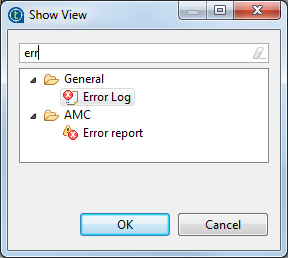
-
Click OK to close the dialog box.
The Error Log view opens in Talend Studio.
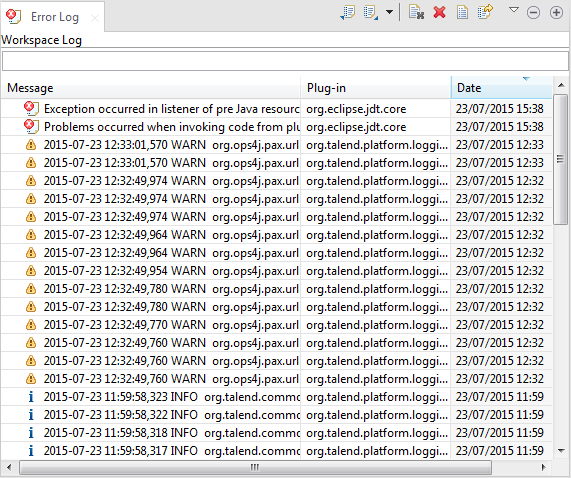 Information noteNote: The filter field at the top of the view lets you do dynamic filtering. For example as you type your text in the field, the list will show only the logs that match the filter.You can use icons on the view toolbar to carry out different management options including exporting and importing the error log files.Each error log in the list is preceded by an icon that indicates the severity of the log:
 for errors,
  for warnings and
  for information.
 -
Double-click any of the error log files to open the Event
Detail dialog box.
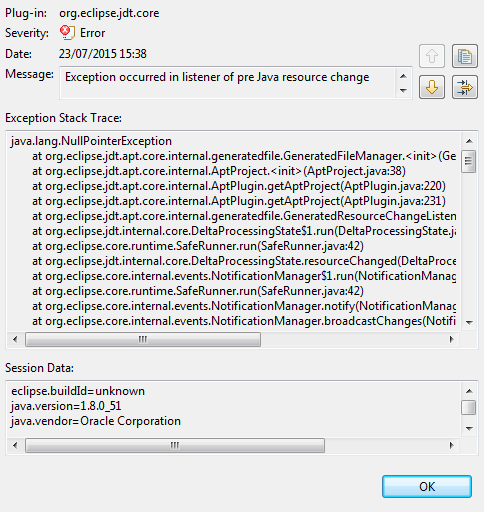
-
If required, click the
 icon in the Event Detail dialog
box to copy the event detail to the clipboard and then paste it anywhere you
like.
icon in the Event Detail dialog
box to copy the event detail to the clipboard and then paste it anywhere you
like.
Did this page help you?
If you find any issues with this page or its content – a typo, a missing step, or a technical error – let us know how we can improve!