
Creating an analysis
Creating a database content analysis
From the Profiling perspective of Talend Studio, you can create an analysis to examine the content of a given database.
About this task
Before you begin, you have defined at least one database connection in the Profiling perspective of Talend Studio.
To create a database content analysis, you must first define the relevant analysis and then select the database connection you want to analyze.
- Click a catalog or a schema to list all tables included in it along with a summary
of their content: number of rows, keys, and user-defined indexes.
The selected catalog or schema is highlighted in blue. Catalogs or schemas highlighted in red indicate potential problems in data.
- Right-click a catalog or a schema and select Overview analysis to analyze the content of the selected item.
- Right-click a table or a view and select Table analysis to create a table analysis on the selected item.
- Click any column header in the analytical table to sort alphabetically the data listed in catalogs or schemas.
Defining the connection overview analysis
Procedure
-
Right-click the Analyses folder and select
New Analysis.
The Create New Analysis wizard opens.
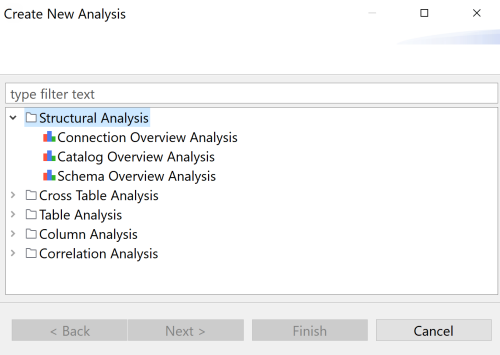
-
In the filter field, start typing connection overview
analysis, select Connection Overview Analysis
from the list that is displayed and click Next.
 You can create a database content analysis in a shortcut procedure if you right-click the database under Metadata > DB connections and select Overview analysis from the contextual menu.
Selecting the database connection you want to analyze
Procedure
-
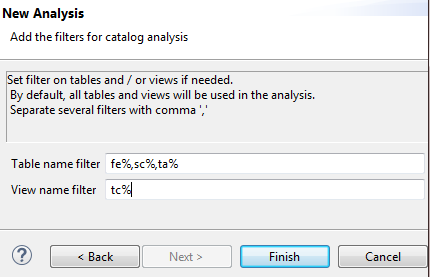
Set filters on the tables and views you want to analyze in their corresponding
fields using the SQL language.
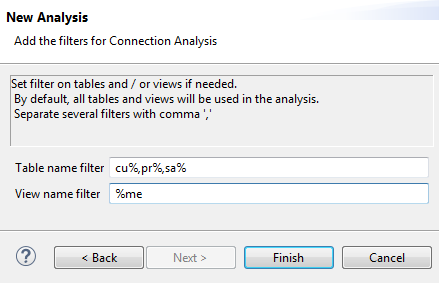 By default, the analysis examines all tables and views in the database.
 -
Click Finish to close the Create New Analysis wizard.
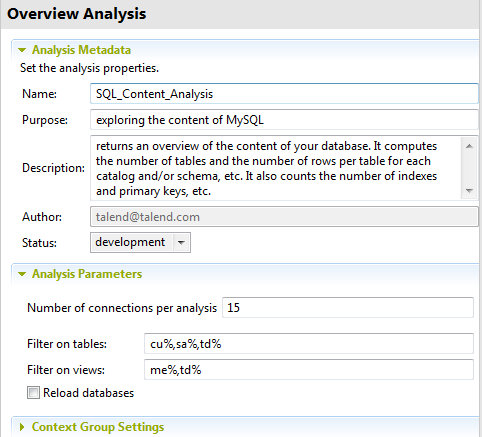
A folder for the newly created analysis is listed under the Analyses folder in the DQ Repository tree view, and the connection editor opens with the defined metadata.
 Information noteNote: The display of the connection editor depends on the parameters you set in the Preferences window. For more information, see Setting preferences of analysis editors and analysis results.
Creating a catalog or schema analysis
You can use the Profiling perspective of Talend Studio to analyze one specific catalog or schema in a database, if this entity is used in the physical structure of the database.
The result of the analysis gives analytical information about the content of this schema, for example number of rows, number of tables, number of rows per table and so on.
Before you begin
At least one database connection has been created to connect to a database that uses the "catalog" or "schema" entity. For further information, see Connecting to a database.
Procedure
-
Set filters on the tables and views you want to analyze in their corresponding
fields using the SQL language.
By default, the analysis examines all tables and views in the catalog.
-
Press F6 to execute the analysis.
A message opens at the bottom of the editor to confirm that the operation is in progress and analysis results are opened in the Analysis Results view.
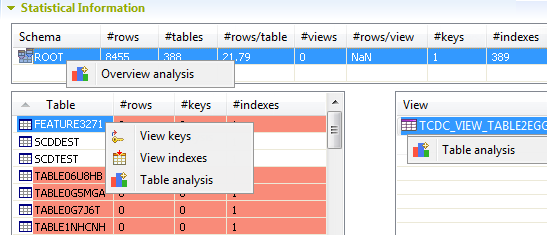
From the Statistical information view, you can:
-
Click the schema to list all tables included in it along with a summary of their content: number of rows, keys, and user-defined indexes.
The selected schema is highlighted in blue. Schemas highlighted in red indicate potential problems in data.
-
Right-click a schema and select Overview analysis to analyze the content of the selected item.
-
Right-click a table or a view and select Table analysis to create a table analysis on the selected item. You can also view the keys and indexes of a selected table. For further information, see Displaying keys and indexes of database tables.
-
Click any column header in the analytical table to sort the listed data alphabetically.
-