Skip to main content Skip to complementary content

Accessing the semantic concepts stored in the ontology repository

The ontology repository built on the Elasticsearch server can store hundreds of semantic concepts and attributes which you can increase every time you define and run a Semantic-aware analysis in the Profiling perspective of Talend Studio.

You can access the list of the semantic concepts and their attributes stored in the ontology repository and applied on several domains including customer, company, geography, product, finance, etc.

This procedure lets you make the ontology repository, used with Talend Studio, accessible and searchable while maintaining its unique features and strengths.

Before you begin

Initializing the data stored in the ontology repository

Before you begin

  • Launch Apache Tomcat which embeds your Talend Administration Center.
  • Launch the Elasticsearch server.

Procedure

  1. Start Talend Studio.
  2. From the top menu bar, select Window > Preferences to open the Preferences window.
  3. From the Preferences window, select Talend > Profiling > Semantic-aware analysis.
  4. If you modified the port or the cluster name, edit the parameters in the corresponding fields.
  5. Click Check Connection to test if you can connect to the repository stored on the Elasticsearch server, and click OK.
  6. Create and run a Semantic-aware analysis from the Profiling perspective of Talend Studio to index and enrich the ontology repository on the Elasticsearch server.

    For more information about the Semantic-aware Analysis, see the Semantic-aware analysis.

Configuring Kibana in Talend Administration Center

From Talend Administration Center, you can set up the parameters of the monitoring modules that allow you to display the content of the ontology repository.

Procedure

  1. Open your Talend Administration Center web application.
  2. In the Menu tree view, click Configuration.
  3. Click the Monitoring node to display the parameters.
  4. In the Kibana URL field, type in the URL address of the Kibana application:

    http://localhost:8080/kibana

    http://localhost:8080/kibana is only given as example. Depending on your configuration, you may have to replace <localhost> with the IP address of the Web server application and <8080> with its actual port.

Creating the index pattern in Kibana

To be able to visualize the concepts and attributes stored in the ontology repository in Kibana, you must create an index pattern.

Procedure

  1. In the Talend Administration Center Menu tree view, click Logging to display the Kibana dashboard, or open a Web browser and go to http://localhost:8080/kibana/#/dashboard/.
  2. From the left panel, click Management > Kibana > Index patterns.
  3. In the Index patterns page, click Create index pattern.
  4. In the Index name or pattern field, enter an index name or pattern that matches the index pattern of the concepts and attributes loaded to Elasticsearch.

    If you want to import the semantic_repository_content-20201211.ndjson file, enter tdq*.

  5. Click Create to add the index pattern.

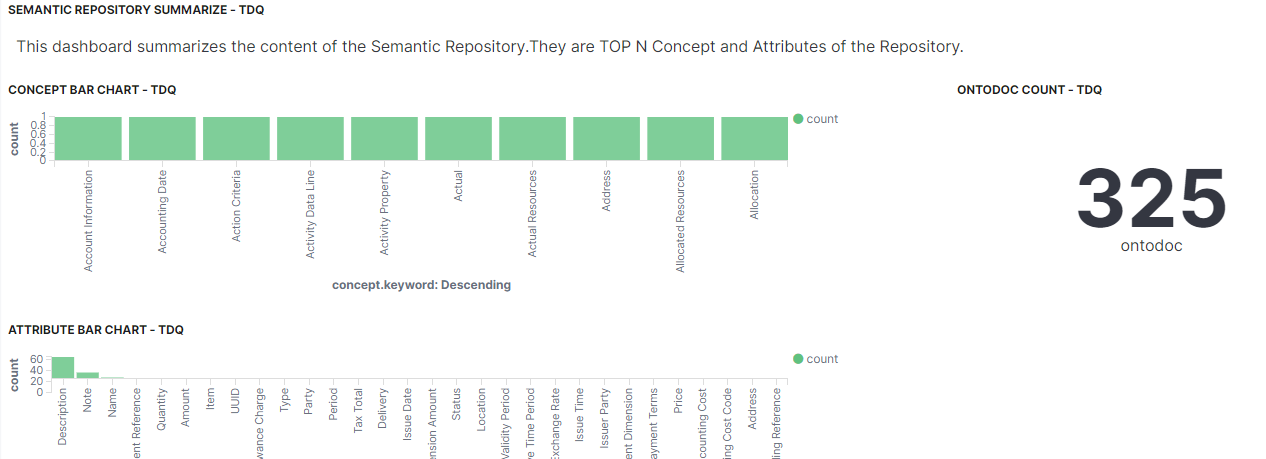
Opening the Kibana dashboard

You can open the Kibana dashboard to visualize the content of the ontology repository.

Procedure

  1. In the Talend Administration Center Menu tree view, click Logging to display the Kibana dashboard, or open a Web browser and go to http://localhost:8080/kibana/#/dashboard/.
  2. From the left menu bar, click Management > Kibana > Saved Objects.
  3. Click Import and browse to the file you downloaded and extracted (semantic_repository_content-20201211.zip).

    The semantic_repository_content-20201211.ndjson file is provided as an example of dashboard that displays visualizations related to the ontology repository.

    You can define your own dashboards and visualizations.

  4. From the left menu bar, click Dashboard.
  5. Select Semantic Repository Dashboard from the list.

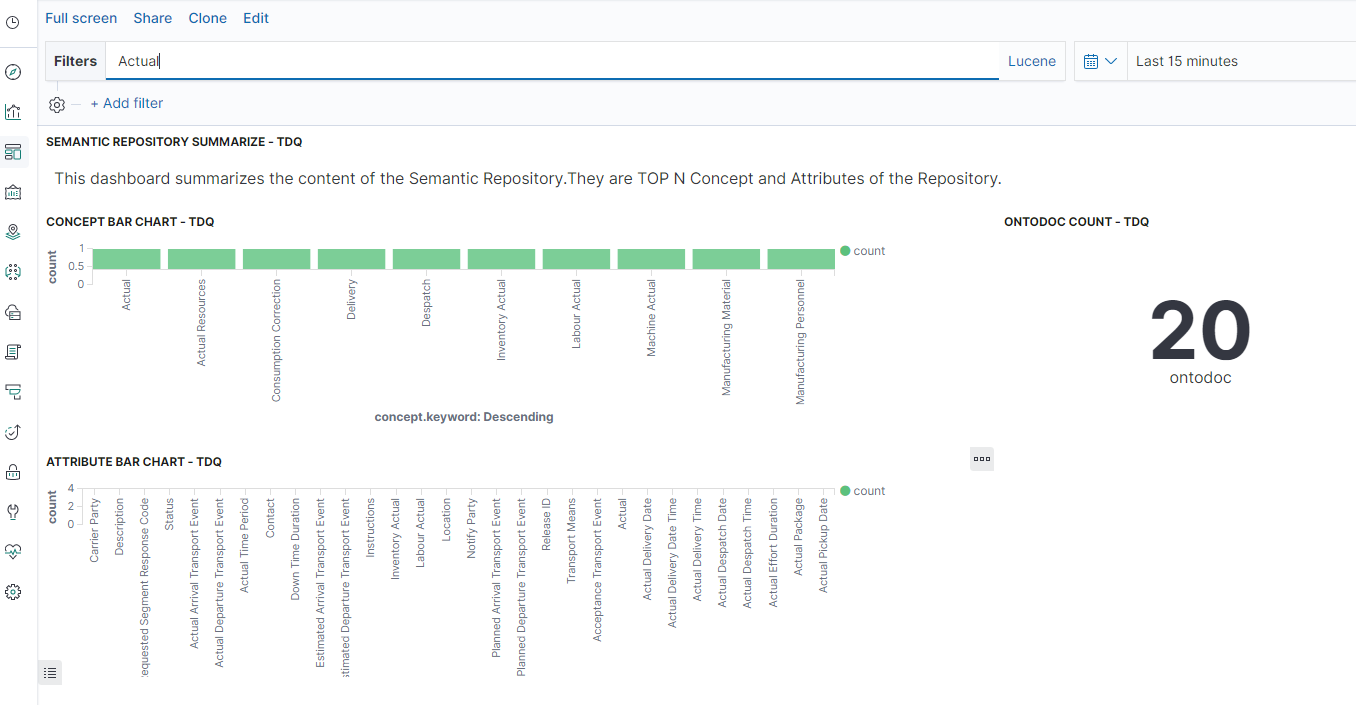
    The dashboard displays the most frequent concepts and the attributes stored in the ontology repository.

    Overview of the most frequent concepts and the attributes stored in the ontology repository
  6. Use the search field on top of the dashboard to search for a concept, an attribute, and filter the results listed in the dashboard.
    Example of a search in the Kibana dashboard.

Did this page help you?

If you find any issues with this page or its content – a typo, a missing step, or a technical error – please let us know!