Skip to main content Skip to complementary content

Analyzing discrete data

This analysis enables you to analyze numerical data. It creates a column analysis in which indicators, appropriate for numeric data, are assigned to the column by default.

Discrete data can only take particular values of potentially an infinite number of values. Continuous data is the opposite of discrete data, it is not restricted to defined separate values, but can occupy any value over a continuous range.

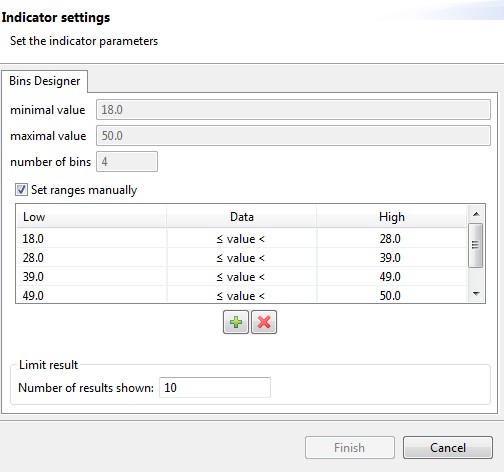
This analysis uses the Bin Frequency indicator that you must configure further in order to convert continuous data into discrete bins (ranges) according to your needs.

Before you begin

At least one database connection is set in the Profiling perspective of Talend Studio. For further information, see Connecting to a database.

Defining the analysis of discrete data

Procedure

  1. In the DQ Repository tree view, expand Metadata and browse to the numerical column you want to analyze.
  2. Right-click the numerical column and select Column Analysis > Discrete data Analysis.
    In this example, you want to convert customer age into a number of discrete bins, or range of age values.
    The New Analysis wizard opens.
  3. In the Name field, enter a name for the analysis.
    Information noteImportant:

    Do not use the following special characters in the item names: ~ ! ` # ^ * & \\ / ? : ; \ , . ( ) ¥ ' " « » < >

    These characters are all replaced with "_" in the file system and you may end up creating duplicate items.

  4. Set the analysis metadata and click Finish.
    The analysis opens in the analysis editor and the Simple Statistics and the Bin Frequency indicators are automatically assigned to the numeric column.
  5. Double-click the Bin Frequency indicator to open the Indicator settings dialog box.
    Overview of the Indicator Settings dialog box.
  6. Set the bins minimum and maximum values and the number of bins in the corresponding fields.
    If you set the number of bins is set to 0, no bin is created. The indicator computes the frequency of each value of the column.
  7. Select the Set ranges manually check box.
    The four read-only fields in the lower part of the Create Bins dialog box show you the data that Tableau uses to suggest a bin size. You can also consider these values if you want to set a bin size manually.
    Continuous numeric data is aggregated into discrete bins. Four ranges are listed in the table with a suggested bin size. The minimal value is the beginning of the first bin, and the maximal value is the end of the last bin. The size of each bin is determined by dividing the difference between the smallest and the largest values by the number of bins.
    You can always modify these values if you want to set a bin size manually. The value in the number of bins field is updated automatically with the new range number.

Running the analysis and accessing the detail analysis results

Procedure

  1. Run the analysis.
    The editor switches to the Analysis Results tab.
    Tables and graphics for the Bin Frequency and the Simple Statistics indicators.
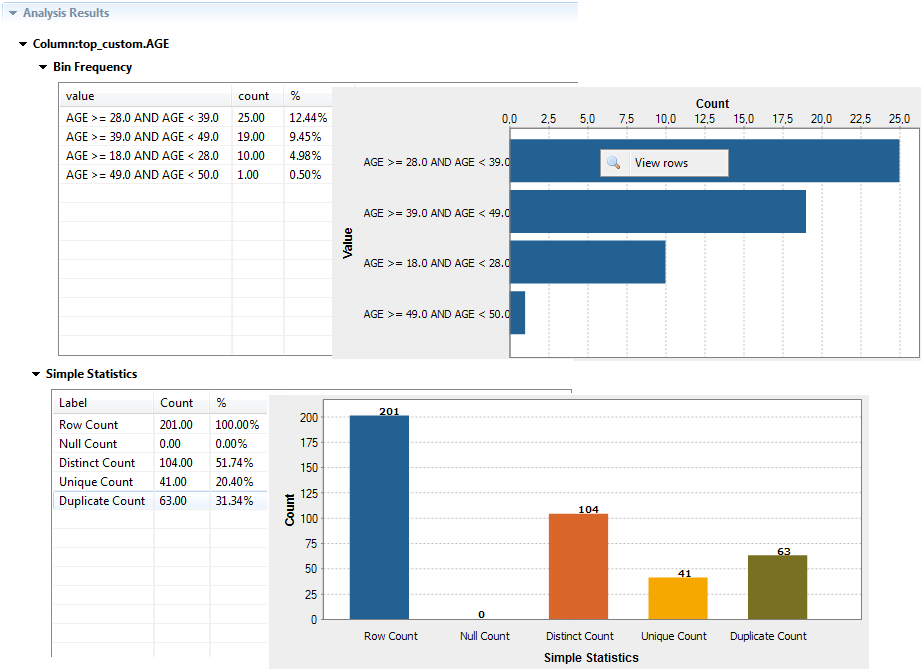
    The analysis creates age ranges with limited and discrete set of possible values out of an unlimited, continuous range of age values.
  2. Right-click any data row in the result tables or in the charts, the first age range in this example, and select View rows to access a view of the analyzed data.
    Overview of the analyzed data from the Data Explorer perspective.
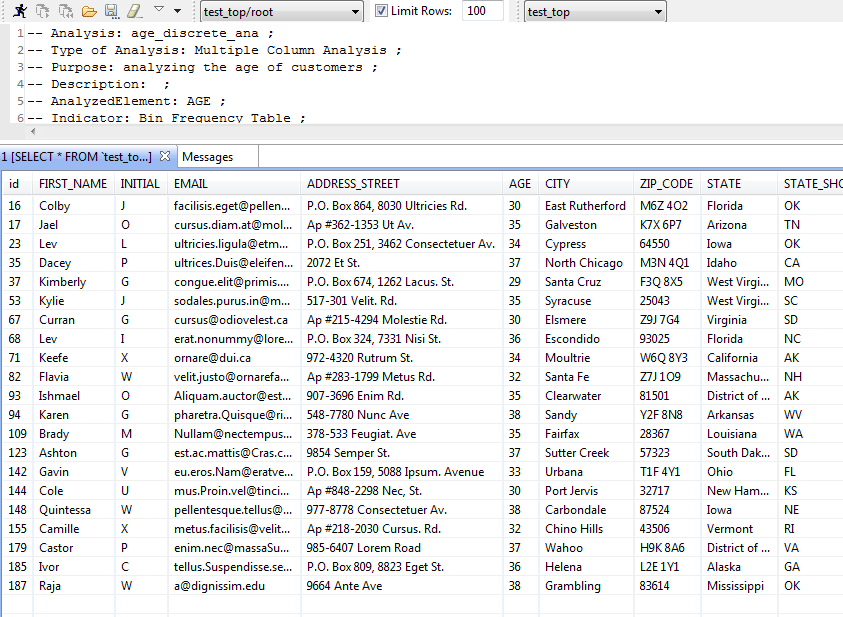
    The SQL Editor opens listing all customers whose age is between 28 and 39.

Did this page help you?

If you find any issues with this page or its content – a typo, a missing step, or a technical error – please let us know!