Skip to main content Skip to complementary content

Creating a time correlation analysis

Before you begin

A database connection is created in the Profiling perspective.

About this task

In the example below, you want to create time correlation analysis to compute the minimal and maximal birth dates for each listed country in the selected nominal column. Two columns are used for the analysis: birth date and country.
Information noteRestriction: The time correlation analysis is possible only on database columns. You can not use this analysis on file connections.

Defining the time correlation analysis

Procedure

  1. In the DQ Repository tree view, expand the Data Profiling folder.
  2. Right-click the Analyses folder and select New Analysis.
    Contextual menu of the Analyses node.
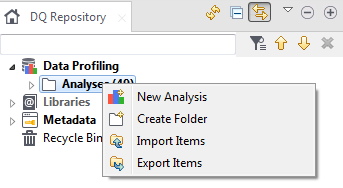
    The Create New Analysis wizard opens.
  3. Start typing time correlation analysis in the filter field, select Time Correlation Analysis and click Next.
  4. In the Name field, enter a name for the current analysis.
    Information noteImportant:

    Do not use the following special characters in the item names: ~ ! ` # ^ * & \\ / ? : ; \ , . ( ) ¥ ' " « » < >

    These characters are all replaced with "_" in the file system and you may end up creating duplicate items.

  5. Set the analysis metadata (Purpose, Description and Author) in the corresponding fields and then click Finish.
    A folder for the newly created analysis is listed under Analysis in the DQ Repository tree view, and the analysis editor opens on the analysis metadata.

Selecting the columns for the time correlation analysis and setting analysis parameters

Procedure

  1. In the analysis editor and from the Connection list, select the database connection on which to run the analysis.
    The time correlation analysis is possible only on database columns for the time being. You can change your database connection by selecting another connection from the Connection list. If the analyzed columns do not exist in the new database connection you want to set, you receive a warning message that enables you to continue or cancel the operation.
  2. Click Select Columns to open the Column Selection dialog box and select the columns, or drag them directly from the DQ Repository tree view into the Analyzed Columns view.
    If you right-click any of the listed columns in the Analyzed Columns view and select Show in DQ Repository view, the selected column will be automatically located under the corresponding connection in the tree view.
  3. If required, click Options in the Indicators view to open a dialog box where you can set thresholds for each indicator.
    The indicators representing the simple statistics are by-default attached to this type of analysis.
  4. In the Data Filter view, enter an SQL WHERE clause to filter the data on which to run the analysis, if required.
  5. In the Analysis Parameterview and in the Number of connections per analysis field, set the number of concurrent connections allowed per analysis to the selected database connection, if required.
    You can set this number according to the database available resources, that is the number of concurrent connections each database can support.
  6. If you have defined context variables in the analysis editor:
    1. Use the Data Filter and Analysis Parameter views to set/select context variables to filter data and to decide the number of concurrent connections per analysis respectively.
    2. In the Context Settings view, select from the list the context environment you want to use to run the analysis.
    For further information about contexts and variables, see Using context variables in analyses.
  7. Press F6 to execute the column comparison analysis.
    The editor switches to the Analysis Results view showing the results.
    Graphic result of the 'birthdate range per nominal values'.
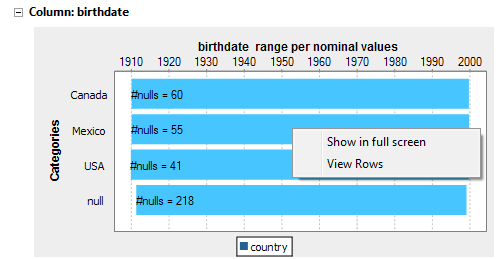
    For detail explanation of the analysis results, see Exploring the results of the time correlation analysis.

Did this page help you?

If you find any issues with this page or its content – a typo, a missing step, or a technical error – please let us know!