
Accessing the Real time statistics page
Talend Administration Center provides you with a Real time statistics page where you can display all job execution statistics.
You can access this page through other different pages in Talend Administration Center, namely Job Conductor, Task execution monitoring and Error recovery management.
The following figure illustrates an example of the Real time statistics page.
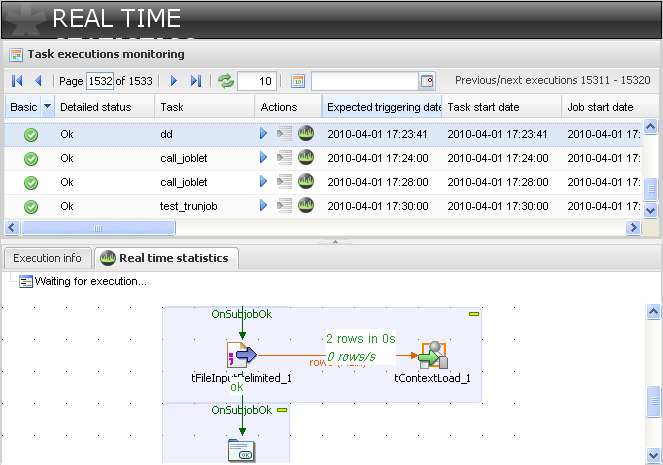
The Real time statistics page is divided into three parts: at the top of the page, the Task execution monitoring tabular list tracking triggered and executed tasks, and at the bottom, Execution Info and Real time statistics views.
 button
docked on the top of the Execution info or Real time
statistics views to display it on full size.
button
docked on the top of the Execution info or Real time
statistics views to display it on full size.The Task execution monitoring list is used the same way as the one available from the Monitoring node. For more information, see Accessing the execution monitoring grid and examining collected data.
For more information about Execution Info and Real time statistics views, see Accessing the Execution info view and Accessing the Real time statistics view.
Did this page help you?
If you find any issues with this page or its content – a typo, a missing step, or a technical error – let us know how we can improve!