
Jobs view
The Jobs view provides the list of Jobs mentioned in the execution log data collected.
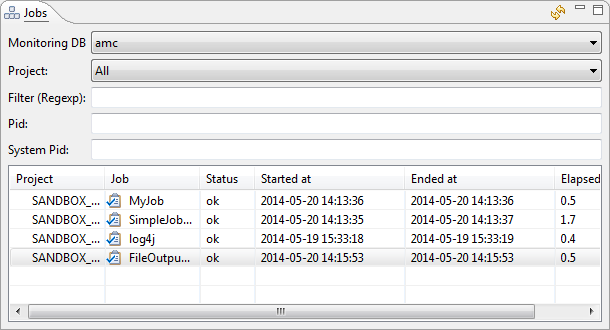
On this view, select a particular Job to display its execution details.
The table provides the following information: the Project name, the Job name, the Start and End times as well as the Execution Elapsed time and the execution Status. All this information can be used in regular expressions to drill down to a particular Job instance.
An icon in front of the Job name indicates the completion status. The events related to the Job selected is shown on the Detailed history view.
The History, Logged Events and Main Chart views help you have an overall picture of the Job execution selected.
The following analysis-support graphical items can help you to improve your Talend processes where needed:
-
The Main Chart view provides a graph representing the various execution instances of the Job selected in the Jobs view.
-
The Job volume view shows a line chart graph illustrating the variations of the selected Job data flow over the time.
-
The Execution Logged Events view provides the warning and error messages generated during the Job execution.
-
The Error report view provides an error-analysis chart.
-
The Threshold Charts view shows a proportional distribution of the processed flow in the Job selected.
For more information on those views, see:
Did this page help you?
If you find any issues with this page or its content – a typo, a missing step, or a technical error – let us know how we can improve!