Skip to main content Skip to complementary content

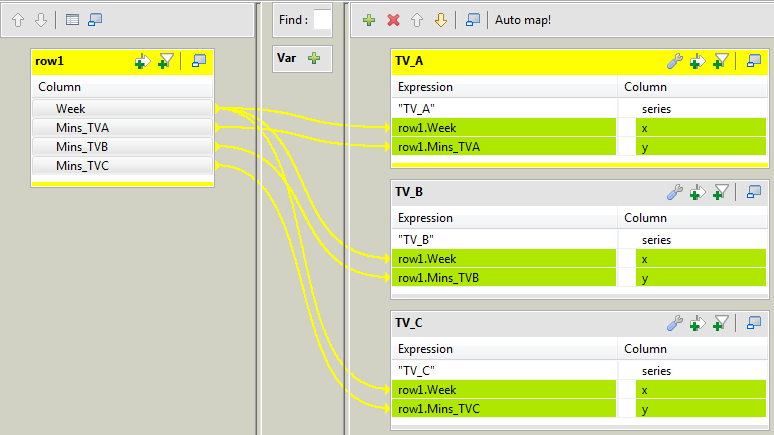
Adapting the source data to the tLineChart schema

Procedure

  1. Double-click the tMap to open the Map Editor.
    You can see an input table on the input panel, row1 in this example, and three empty output tables, named TV_A, TV_B, and TV_C on the output panel.
  2. Use the Schema editor to add three columns to each output table: series (string), x (integer), and y (integer).
  3. In the relevant Expression field of the output tables, enter the text to be presented in the legend area of the line chart, TV A, TV B, and TV C respectively in this example.
  4. Drop the Week column of the input table onto the x column of each output table.
  5. Drop the Mins_TVA column of the input table onto the y column of the TV_A table.
  6. Drop the Mins_TVB column of the input table onto the y column of the TV_B table.
  7. Drop the Mins_TVC column of the input table onto the y column of the TV_C table.
  8. Click OK to save the mappings and close the Map Editor and propagate the output schemas to the output components.

Did this page help you?

If you find any issues with this page or its content – a typo, a missing step, or a technical error – let us know how we can improve!