
Analytical Processing
About this task
Talend DQ Portal provides an access to Online Analytical Processing (OLAP) on the data resulted from the analyses carried on in the Profiling perspective of Talend Studio. In this page, you can easily and selectively extract and view data based on multi-dimensional analytical queries and save the most interesting view.
The Analytical Processing page in the web user interface gives an access to a document with time and indicator dimensions and their corresponding measures (values of threshold indicators). The view can also be displayed in the form of a bar chart.
The below figure illustrates an example of an OLAP document:
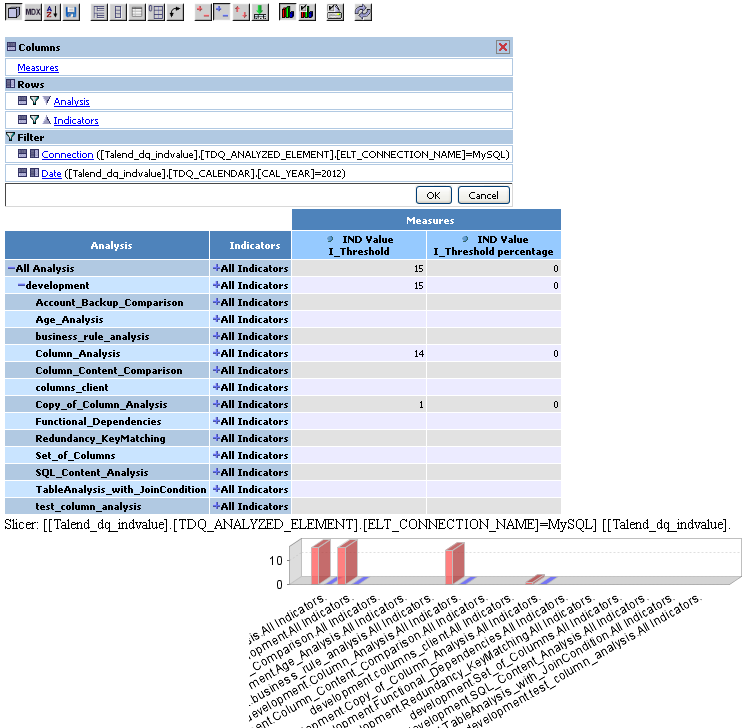
An OLAP document is a way to inquiry your business data freely and dynamically. This means that normally the user starts his analysis from a predefined view and then he can completely change the inquiry interacting with the platform.
-
You have accessed Talend DQ Portal as a user.
-
Some reports have been generated in the Profiling perspective of Talend Studio.
To change the inquiry that interacts with the platform, do the following:
Procedure
-
On the toolbar, click the
 icon, expand tdq_user and
select tdq_olap.
icon, expand tdq_user and
select tdq_olap.
Example
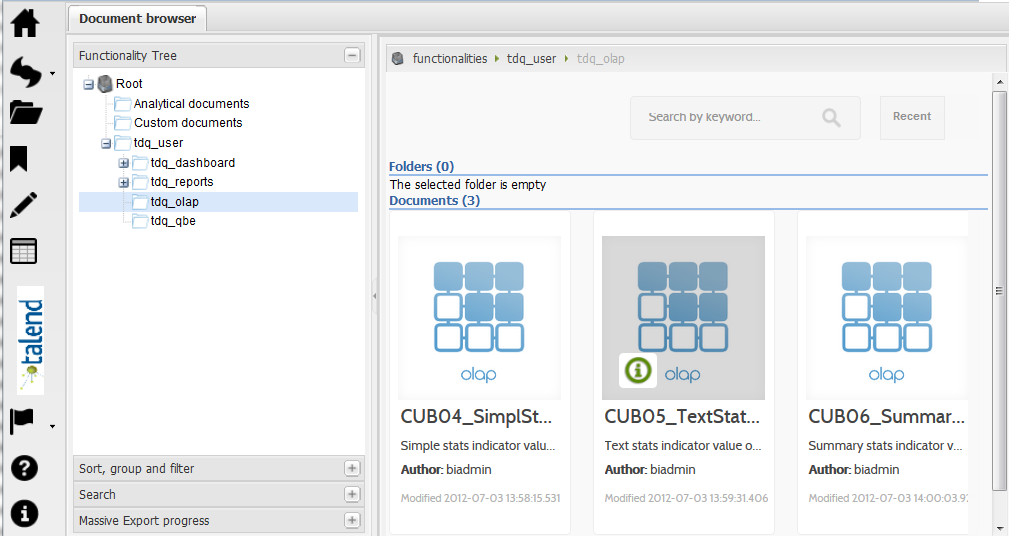 A page opens with documents on Simple statistics, Summary statistics and Text statistics.
 -
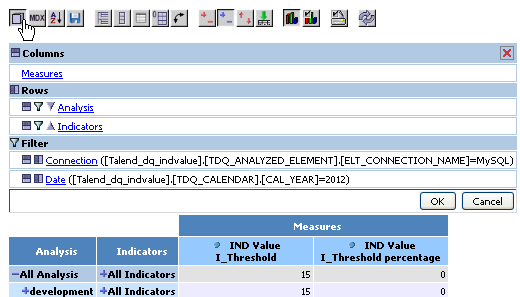
From the toolbar of the page, click the
 OLAP navigator icon to open a matrix table.
Here you can set the parameters of the query and decide what data to analyze.
OLAP navigator icon to open a matrix table.
Here you can set the parameters of the query and decide what data to analyze.Example
-
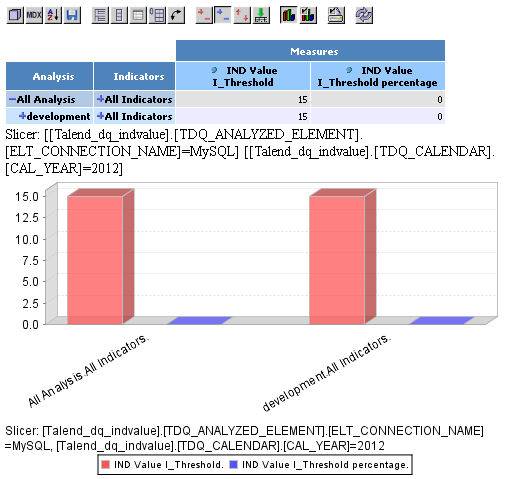
Click the
 icon on the toolbar to display the extracted data in the form
of a bar chart.
icon on the toolbar to display the extracted data in the form
of a bar chart.
Example
-
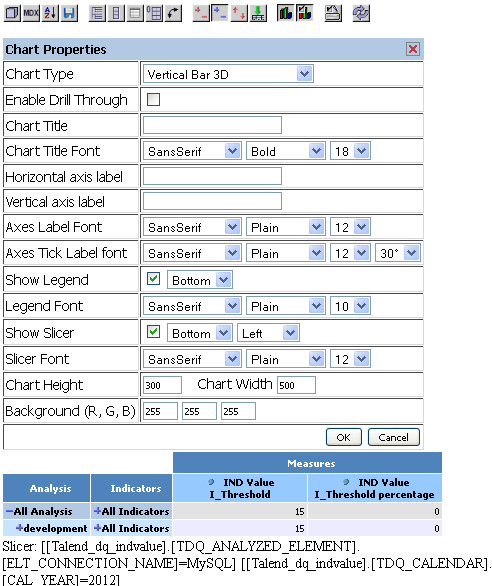
If required, click the
 icon on the toolbar to open a view where you can configure the
chart display.
icon on the toolbar to open a view where you can configure the
chart display.
Example
Did this page help you?
If you find any issues with this page or its content – a typo, a missing step, or a technical error – let us know how we can improve!