
Browsing Service Metadata in Kibana dashboard
About this task
A Kibana dashboard definition Service-Registry-Dashboard.json is provided in the /add-ons/ registry/dashboard folder for browsing metadata stored in ElasticSearch with Kibana. This dashboard is designed for the example metadata schema which comes with the Talend ESB installation. For custom metadata, the dashboard definition must be modified to reflect the properties of the custom metadata.
To install the dashboard:
Procedure
-
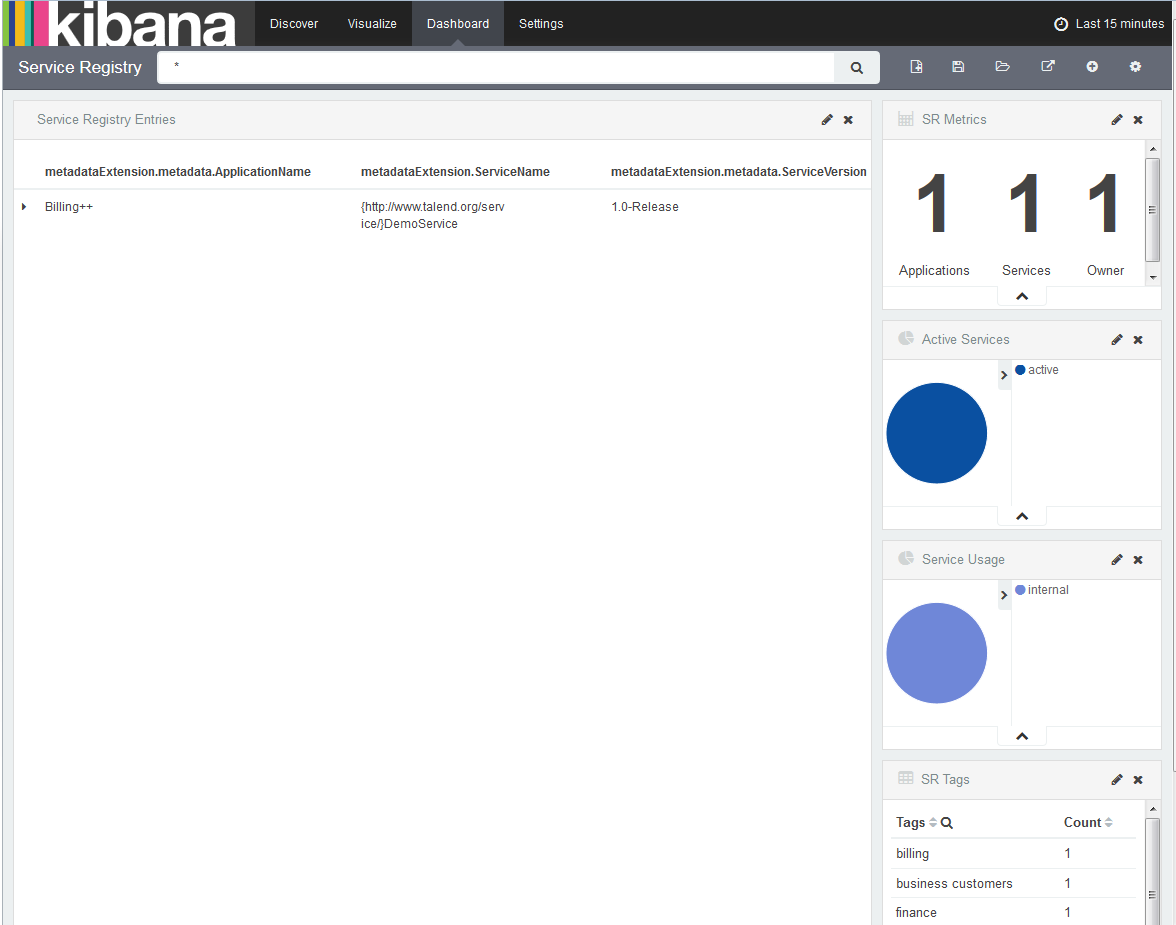
Switch to the Dashboard page, click Load Saved
Dashboard, then select Service Registry. You will see the Service Registry
metadata dashboard is shown:
Example
Did this page help you?
If you find any issues with this page or its content – a typo, a missing step, or a technical error – let us know how we can improve!