Skip to main content Skip to complementary content
Close announcements banner

Displaying the collected activity monitoring information

Procedure

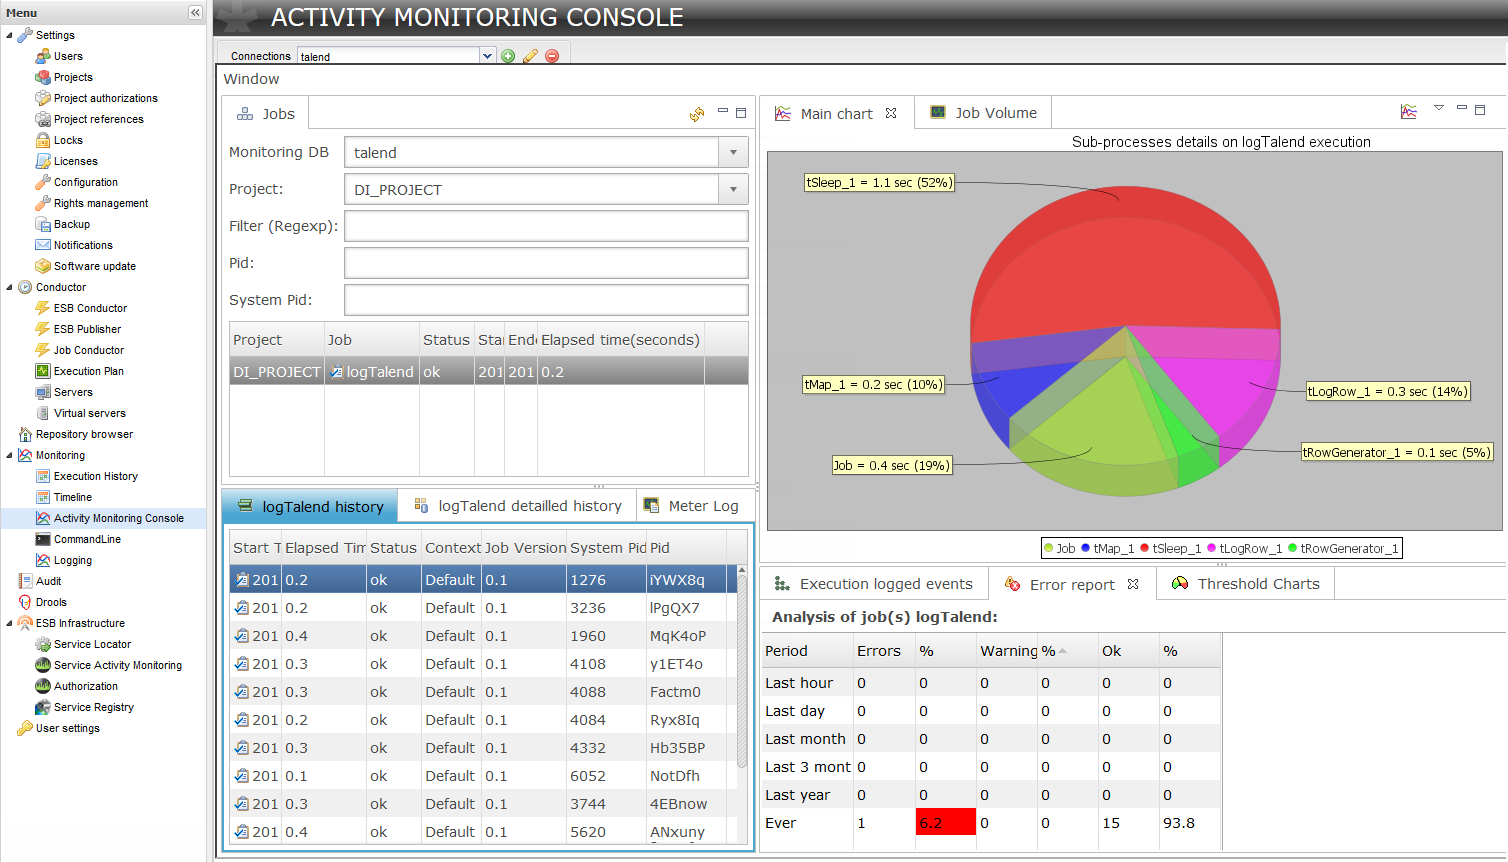
  1. In the Menu tree view, click Activity Monitoring Console to display the corresponding page.

    Example

  2. On the Activity Monitoring Console page, select the active connection of the database where you save the log tables.
    Once the connection to the applicable database table is set up, you can view the various Jobs being monitored.
    Information noteNote: This log database will be connected to your active session on the Monitoring pages and any future session on the Monitoring pages will be directly connected to this database. You can load a different database when needed.
    For more information about the various monitoring views, see the section about the Graphical User Interface in the Talend Activity Monitoring Console User Guide.

Did this page help you?

If you find any issues with this page or its content – a typo, a missing step, or a technical error – let us know how we can improve!