
Viewing and exporting analyzed data
Before you begin
- You have selected the Profiling perspective.
- A column analysis has been created and executed.
About this task
- Using the SQL or the Java engine and from the Analysis Results view of the analysis editor, you can right-click any of the rows in the statistic result tables and access a view of the actual data.
- Using the Java engine, you can use the analysis results to access a view of the actual data.
- Using the SQL engine, you can use the analysis results to open the Data Explorer perspective and access a view of the actual data.
Procedure
-
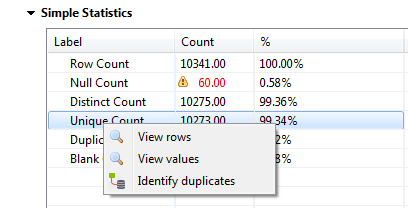
Right-click a data row in the statistic results of any of the analyzed columns and select
an option as the following:
Option
Operation
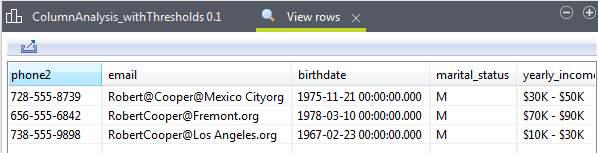
View rows
Open a view on a list of all data rows in the analyzed column.
Information noteNote: For the Duplicate Count indicator, the View rows option will list all the rows that are duplicated. So if the duplicate count is 12 for example, this option will list 24 rows.View values
Open a view on a list of the actual data values of the analyzed column.
Identify duplicates
generate a ready-to-use Job that identifies and separates unique and duplicate records in the selected column for subsequent processing. This Job outputs all the duplicates in a reject CSV file by default, and writes the unique values in another separate file. For further information, see Generating a Job to Identify duplicate values in an analyzed column.
Options other than the above listed ones are available when using regular expressions and SQL patterns in a column analysis.
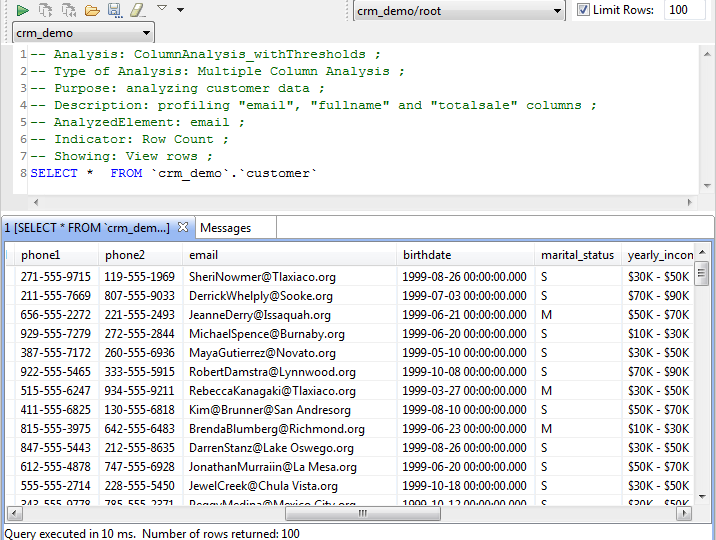
When using the SQL engine, the view opens in the Data Explorer perspective listing the rows or the values of the analyzed data according to the limits set in the data explorer.
If the Data Explorer perspective is missing from the Studio, you must install certain SQL explorer libraries that are required for data quality to work correctly, otherwise you may get an error message.
For further information about identifying and installing external modules, see the Talend Installation and Upgrade Guide.
 Information noteWarning: The data explorer does not support connections which has empty user name, such as Single sign-on of MS SQL Server. If you analyze data using such connection and you try to view data rows and values in the Data Explorer perspective, a warning message prompt you to set your connection credentials to the SQL Server.
When using the Java engine, the view opens in the Studio listing the number of the analyzed data rows you set in the Analysis parameters view of the analysis editor.
-
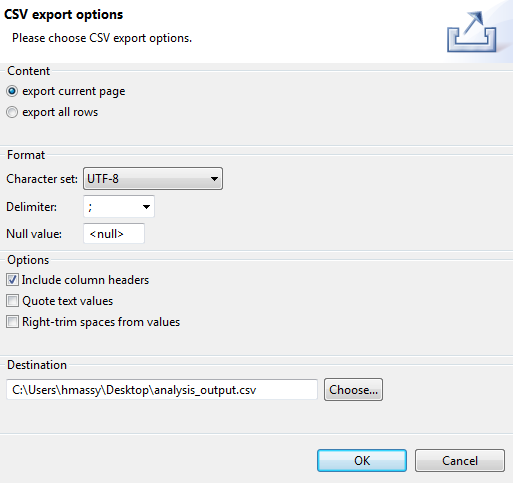
From this view, you can export the analyzed data into a CSV file:
-
Click the
 icon in the upper left corner of the view.
-
A dialog box opens.
-
Click the
Did this page help you?
If you find any issues with this page or its content – a typo, a missing step, or a technical error – let us know how we can improve!