
Filtering values manually
In order to have a more specific idea of the data contained in your dataset or in order to perform functions on a certain subset of data, you can create a filter on your data.
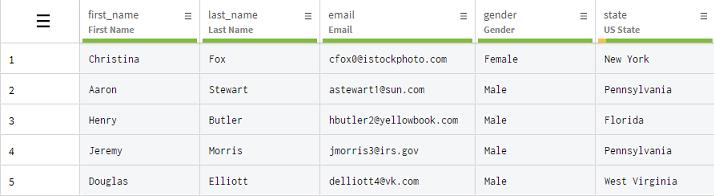
This example uses a dataset with typical customer information, such as their names, age, email or state they live in. You are going to create some filters to only display the male customers from California, by using the search field, as well as the Add filter button.
Procedure
-
In the Add a filter field on the top left of the grid,
start typing the value you want for your filter,
california in this example. Talend Data Preparation
suggests columns containing this value.
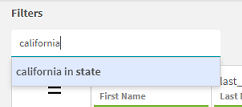
The suggestions are based on the data that is contained in the sample.
-
Select california in state to only display the entries
corresponding to this location.
You can see in the Filter bar that the filter has been correctly applied with the contains operator.
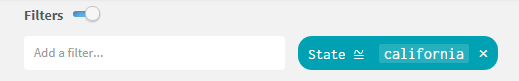
Filter badges can be edited to search for any value.
The Add a filter field is convenient to quickly search for a value across the whole sample, but you can also be more accurate and manually select which column, operator, and keyword to use. You will now apply another filter, to isolate the male customers, among the ones already filtered, this time with the Add filter button.
-
Enter male as keyword,
and click Apply to add this filter to the previous
one.
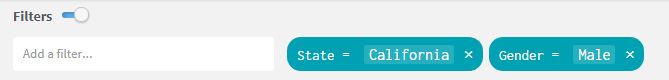
The grid now only displays the data corresponding to those two filters
Results
You have filtered your data to isolate a specific customer group and you can start applying function and work on this sample only.
You can apply filters manually, or use the charts panel to create even more complex filters.
Did this page help you?
If you find any issues with this page or its content – a typo, a missing step, or a technical error – let us know how we can improve!