
Running the analysis and accessing the detail analysis results
Procedure
-
Run the analysis.
The editor switches to the Analysis Results tab.
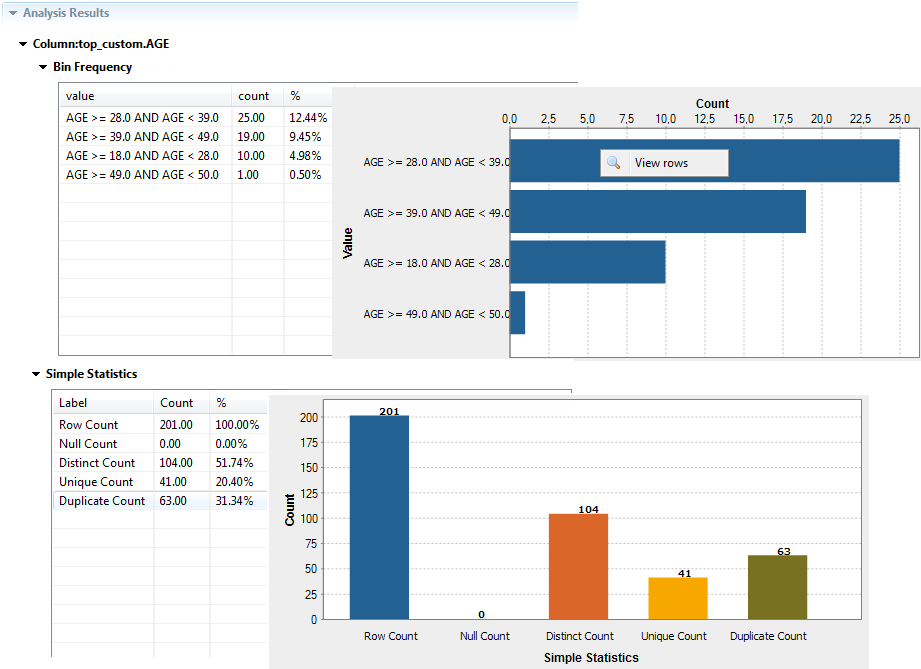 The analysis creates age ranges with limited and discrete set of possible values out of an unlimited, continuous range of age values.
 -
Right-click any data row in the result tables or in the charts, the first age
range in this example, and select View rows to
access a view of the analyzed data.
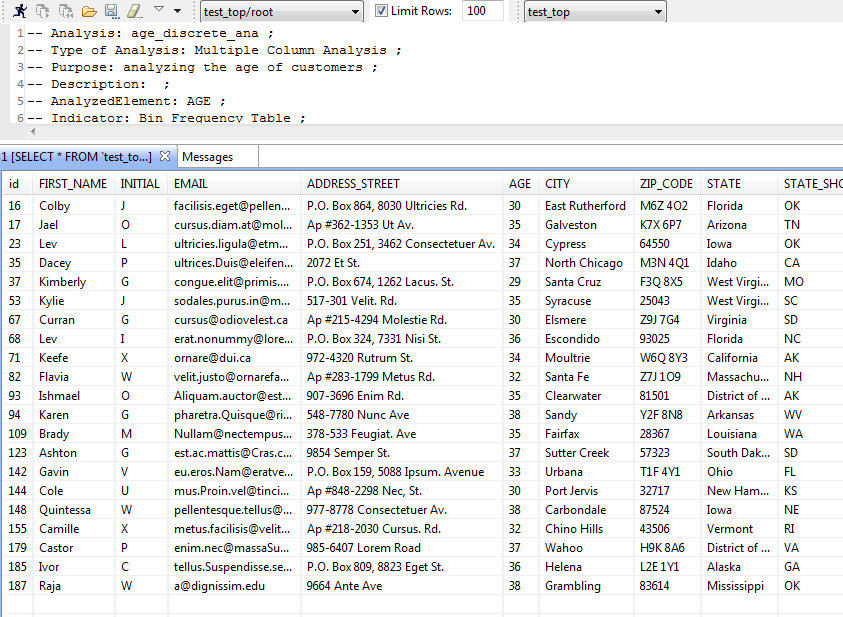 The SQL Editor opens listing all customers whose age is between 28 and 39.
Did this page help you?
If you find any issues with this page or its content – a typo, a missing step, or a technical error – let us know how we can improve!