
Creating a filter
Creating a filter is a quick way to identify or isolate data.
You will isolate the values in the phone column that actually match the pattern defined in the previous step. This will be possible through the use of a filter on the values that were found as true in the phone_matching column.
Procedure
-
In the data profiling area, on the bottom right of the screen, you can see an
horizontal bar chart, displaying the number of occurrences of the
true and false values.
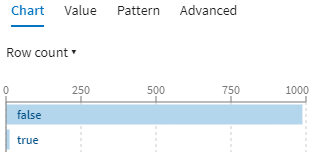
Diagrams are a convenient and quick way to apply filters on your data, for one or several columns at a time.
-
Click the bar displaying the true values.
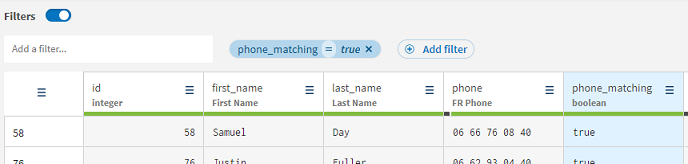
A filter is applied on your data, and only the entries that match the value true are displayed in the grid, as you can see in the filter bar.
Results
The data is filtered on the value true, and you will now work on this small sample of data.
Did this page help you?
If you find any issues with this page or its content – a typo, a missing step, or a technical error – let us know how we can improve!