
Monitoring the execution of your Jenkins pipeline
Before you begin
- You have started the execution of your pipeline.
- Your artifact repository (Nexus or Artifactory) is started.
Procedure
- From the Jenkins home page, select TalendSimplePipeline.
- Click Open Blue Ocean in the left panel.
- Click the new line that appears on the list to see the pipeline progress.
Results
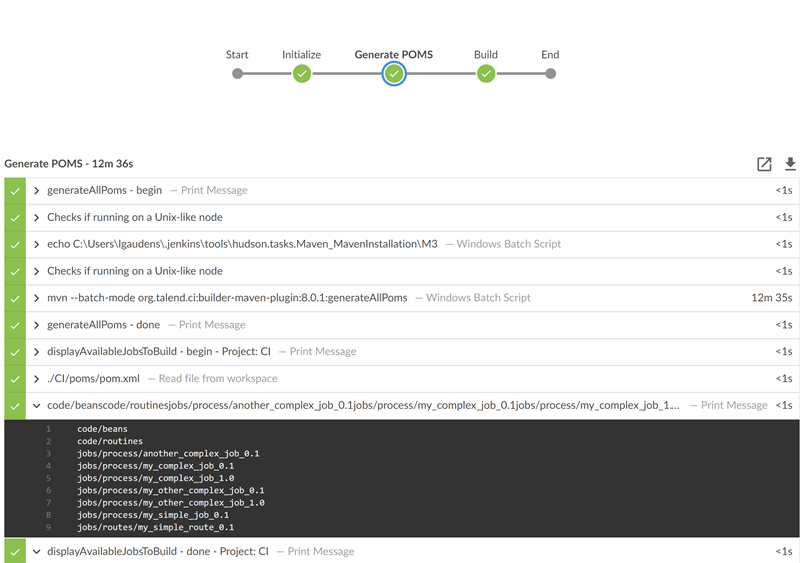
The pipeline is launched and your project is being processed according to the Maven phases that have been defined in your script. The best practice is to use the deploy phase in order to generate the source code, compile it, test it, package it and then deploy the packages.
You can see their results displayed:
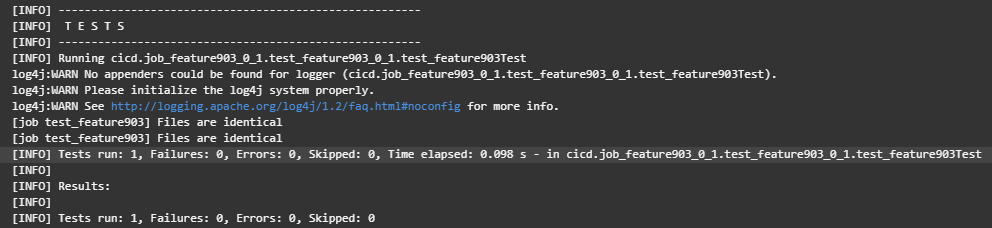
- in Jenkins: the detail of your results can be found in the logs that you can display
by clicking the Display the log in new window icon.Example where you can see the successful execution of the test named test_feature903:
- in Talend Management Console:
example of Job and Route artifacts with version 0.1.0 deployed
in the ci-workspace workspace of the
dev-ci environment:
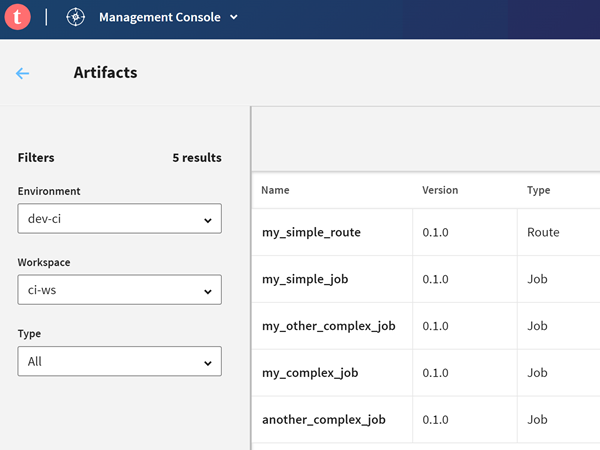
The option to display Git information (author, commit ID, commit date) in Talend Management Console when publishing artifacts using Continuous Integration builds is available from version 8.0.1 onwards (available from R2022-01).
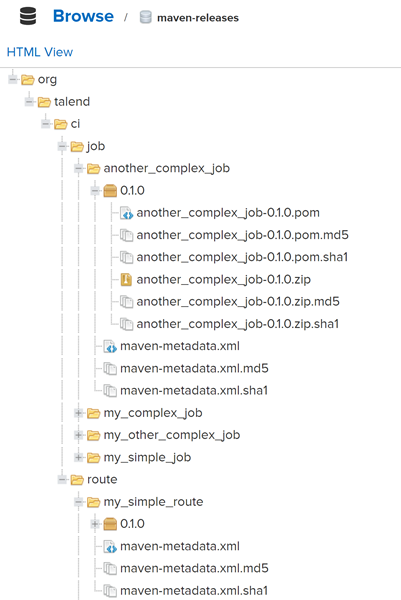
- in your artifact repository: example of Job and Route artifacts with version
0.1.0 deployed in the Nexus
maven-releases repository with an
org.talend.ci Group ID:
- in your Docker registry: example of Job artifacts with version
0.1 and latest pushed to a Docker
image called ci_image:

Did this page help you?
If you find any issues with this page or its content – a typo, a missing step, or a technical error – let us know how we can improve!