
Customizing the Main Chart and the Job Volume views
Depending on the type of view, you have access to various graph and data display options.
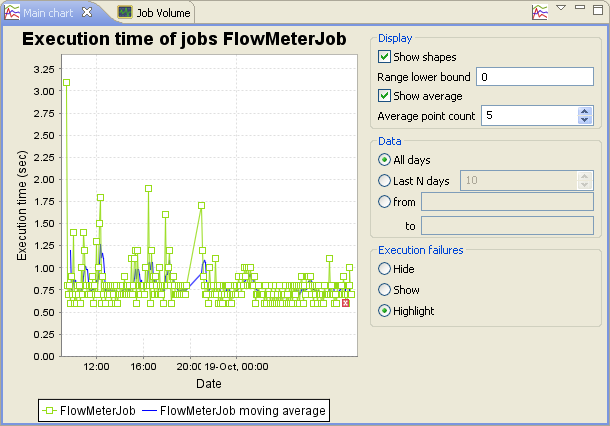
To customize the Main chart and Job Volume views, click the down arrow docked at the top right end of Talend Activity Monitoring Console main interface to show the display options.
Alternatively, you can customize the main chart display in the Preferences window. To do this, select Window > Preferences from the menu, then expand the AMC node and select Charts.
Did this page help you?
If you find any issues with this page or its content – a typo, a missing step, or a technical error – let us know how we can improve!