
Shape display
When the Main Chart or Job Volume view displays a line chart or a multiple line chart, each execution instance is represented by a shape as a milestone on the line graph.
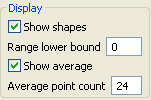
You can choose to show or hide these execution nodes from the graph, by selecting or clearing the Show shapes check box.
You can also define the Range Lower Bound to rescale the chart at your convenience on the vertical (y) execution time axis. Reset this boundary to fit best the line chart on the graph.
Select the Show average check box to display a new line chart presenting the average of the last N points, where N is the number defined in the Average point count field.
Did this page help you?
If you find any issues with this page or its content – a typo, a missing step, or a technical error – let us know how we can improve!