
Run the analysis with different probability distributions
Procedure
-
Run the Job with the Geometric distribution,
then click the Chart in the Profiling to show the duplicates generated according
to the Geometric distribution.
The table below shows how results of the generated duplicates differ according to the probability distribution you select in the tDuplicateRow component.
Probability distribution
Duplicate results
Description
Bernoulli distribution
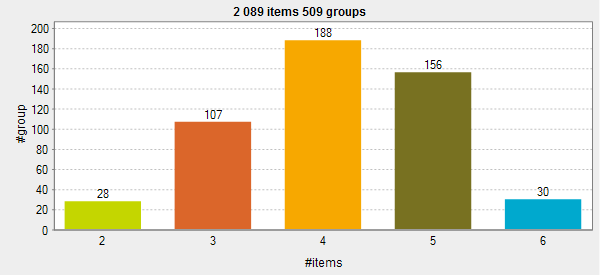
The curve is symmetrical. The groups of duplicates are distributed evenly on each side of an average value, 4 in this example. This average value is the average number of duplicates in a group of duplicates and this value is the number you set in the Average group size field in the basic settings of the tDuplicateRow component.
Poisson distribution
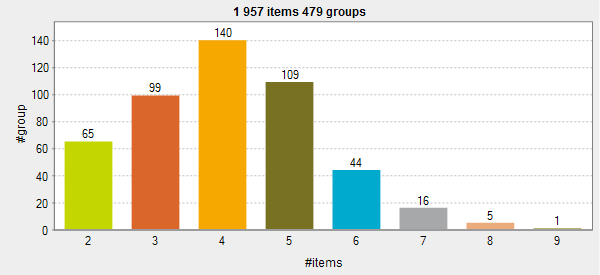
The curve is not symmetrical. The groups of duplicates are distributed unevenly.
Geometric distribution

The form of the curve is decided by the percentage you set for the duplicated records in the tDuplicateRow basic settings. The higher the percentage is, the fewer groups with many records you will have.
In this example the percentage for the duplicate records is set to 80%. This is why many groups with two-record duplicates are generated (148 groups), while there is only one group that has 14, 15 and 16 duplicates.
Did this page help you?
If you find any issues with this page or its content – a typo, a missing step, or a technical error – let us know how we can improve!