
The Advanced tab
The Advanced tab is available only for numeric values. A boxplot gives you insights on the record distribution of the column. The boxplot displays the following information:
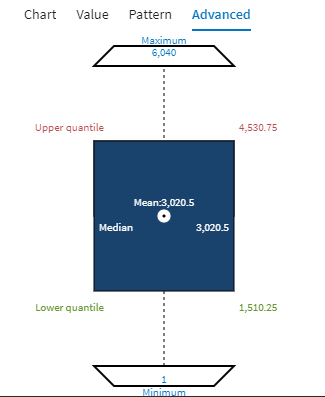
- Maximum: The highest value of the column records
- Minimum: The lowest value of the column records
- Mean: The mean value of the column records
- Median: The median value of the column records
- Upper quartile: The median value between the median and the highest value (maximum) of the column records
- Lower quartile: The median value between the lowest value (minimum) and the median value of the column records
Did this page help you?
If you find any issues with this page or its content – a typo, a missing step, or a technical error – let us know how we can improve!