
The Chart tab
The Chart tab shows a graphical representation of your data. It is also a quick and easy way to apply filter on your data.
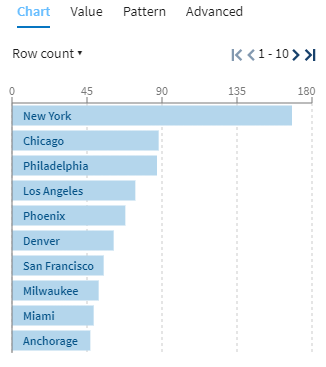
According to the data type or semantic type that you select, the graphical representation of the distribution of values in the tab will be different:
- Vertical bar charts for numerical data
- Horizontal bar charts for text data
- World map for Continent and Continent Code, Country, Country Code ISO2 and Country Code ISO3
- Map of North America for North American state and North American state code
- US map for US State and US State Code
- Map of Mexico for MX Estado and MX Estado Code
- Map of Canada for CA Province Territory and CA Province Territory Code
- Map of France for FR Departement, FR Region and FR Region Legacy
For more information and examples, check Filtering values using charts.
Did this page help you?
If you find any issues with this page or its content – a typo, a missing step, or a technical error – let us know how we can improve!