This content is only available if you are using the product in hybrid mode.
You can see the quality of a campaign in the Tasks and Campaigns tabs.
Before you begin
Information noteImportant:Data quality rules can only be used in Resolution and Merging
campaigns. The quality bar that allows you to see the results of the data quality
rule is not available in the other campaigns.
You applied at least one data quality rule to a data model.
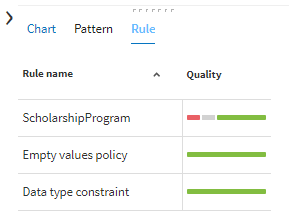
The rules applied to the value are displayed. You see the quality bar of
the data quality rules and also of the constraints. For more information, see
Filtering tasks using rules.
You can see up to three colors:
Color
Description
Green
The values are valid. They
fulfill all rule statements.
Gray
The values are not
applicable. They do not fulfill the condition and no alternative
validation expression has been defined.
Red
The values are invalid. They fulfill the condition but
not the validation expression or the rule cannot be executed on those
values. For example, if the rule must compare a string with a number. For
more information on the errors, click the red vertical bar next to the
value.
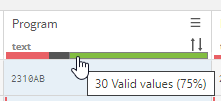
Hover over each color to display the total number and percentage of
values.
Following the example:
26 values are valid, i.e. the students have US citizenship, their status
code is 2632 and their scholarship program ends with 10AB or 10AC.
7 values are not applicable, i.e. the students are not from the US or
their status code is not 2632.
7 values are invalid, i.e. the students have US citizenship, their status
code is 2632 but their scholarship program does not end with 10AB or
10AC or it does not take effect on September 1st, 2021.
For more information on an invalid value, click the red vertical bar.
For more information on each column, hover over the quality bar of the
column.
The quality bar is composed of the results of the constraints and data quality
rules.
You can see up to three colors:
Color
Description
Green
The values are valid according to the constraints and data
quality rules. The non-applicable values1 from data
quality rules are marked as green.
Grey
The fields are empty. The empty values for a mandatory field
are marked as red.
Red
The values are invalid according to a constraint or data
quality rule.
1 The values are not applicable when they do not fulfill
the condition of the data quality rule, and no alternative
validation expression has been defined.
Did this page help you?
If you find any issues with this page or its content – a typo, a missing step, or a technical error – let us know how we can improve!

 You can see up to three colors:
 Following the example:
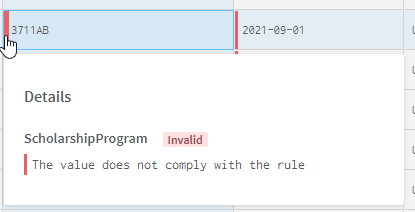
 You can see up to three colors: