
Selecting the set of columns you want to analyze
Procedure
-
In the desired database, browse to the columns you want to analyze, select them and
click Finish to close the wizard.
In this example, you want to analyze a set of six columns in the customer table: account number (account_num), education (education), email (email), first name (fname), second name (Iname) and gender (gender). The statistics presented in the analysis results are the row count, distinct count, unique count and duplicate count which all apply on records (values of a set of columns).The analysis editor opens with the defined analysis metadata, and a folder for the newly created analysis is displayed under Analyses in the DQ Repository tree view.A sample data is displayed in the Data Preview section and the selected columns are displayed in the Analyzed Column section of the analysis editor.
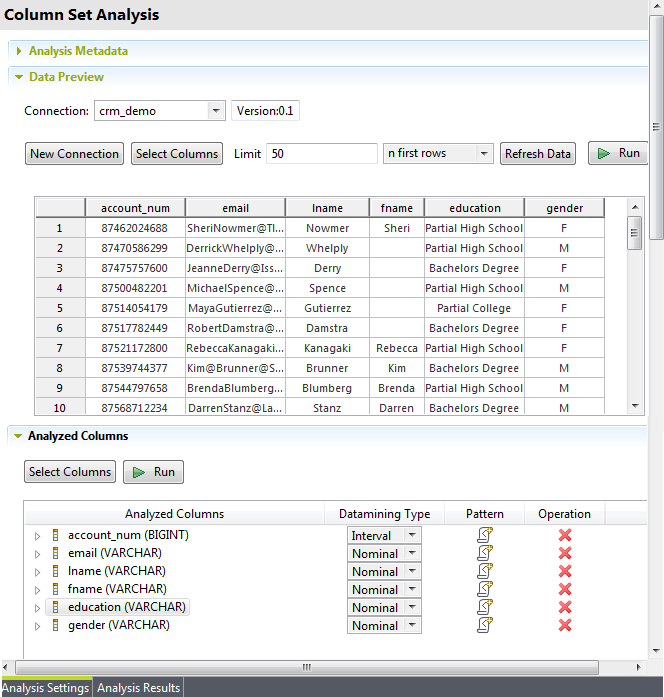
In this example, you want to analyze a set of six columns in the customer table: account number (account_num), education (education), email (email), first name (fname), second name (Iname) and gender (gender). The statistics presented in the analysis results are the row count, distinct count, unique count and duplicate count which all apply on records (values of a set of columns).
Did this page help you?
If you find any issues with this page or its content – a typo, a missing step, or a technical error – let us know how we can improve!