
How to access the Recovery checkpoints view
Procedure
-
In the lower part of the page, click the Recovery
checkpoints tab.
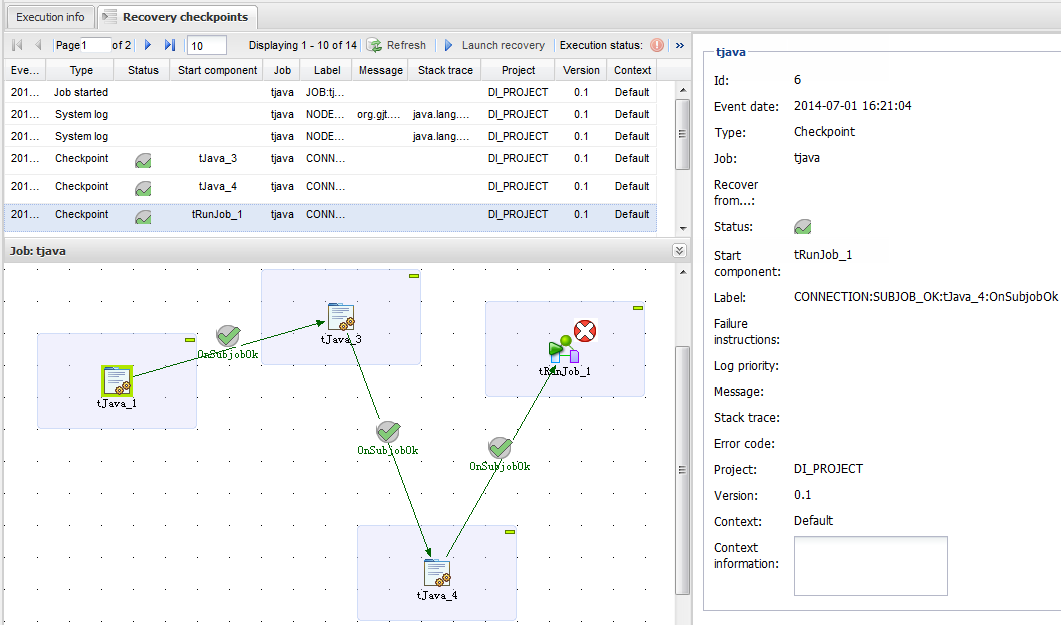
The recovery checkpoints of the monitored Job are listed, along with job execution logs if any.Information noteNote: If the checkpoint list does not appear, click the Refresh button of the Recovery checkpoint view.The following figure illustrates an example of the Recovery checkpoints view.
 Information noteNote: You can click the
 button to the right of the view to open the
information panel.This view provides the following:
button to the right of the view to open the
information panel.This view provides the following:- at the top, a list of the checkpoints initiated on the trigger connections that are set when designing the Job in Talend Studio. For more information on this list, see How to access the checkpoint list.
- in the Job panel below the checkpoint list, a
capture of the monitored Job including a
 icon
on every trigger connection initiated as a checkpoint when designing the
Job in Talend Studio,
icon
on every trigger connection initiated as a checkpoint when designing the
Job in Talend Studio, - in the information panel to the right, the detail of any event (check point, user defined log, the start or end of the Job) that you select in the job capture or in the checkpoint list. For more information on the information panel, see How to display the detail of a specific recovery event. For more information on the checkpoint list, see How to access the checkpoint list.
Did this page help you?
If you find any issues with this page or its content – a typo, a missing step, or a technical error – let us know how we can improve!