
Using charts to calculate absolute value
Calculating the absolute value of a number is one of the various mathematical functions available to use on your data.
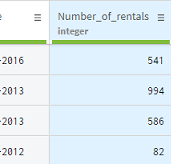
If you take a close look at the Number_of_rentals column, you will notice that some of the numbers have a negative value.
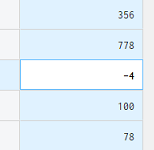
These cells are not marked as incorrect in the quality bar because they still fit the semantic type automatically set as integer. Nevertheless, this is unusable data. As a consequence, you are going to apply a function to remove the negative sign for all these numbers.
To calculate the absolute value of your data, proceed as follows:
Procedure
-
Click the header of the Number_of_rentals column to
select its content.
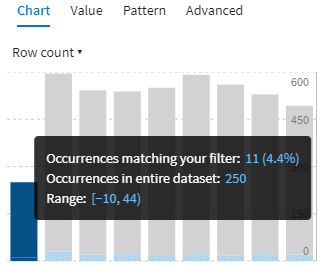
In the statistics box, you can clearly see that some values are between -10 and 0.
-
In the vertical bar chart at the bottom right of the screen, click the first
bar from the left.
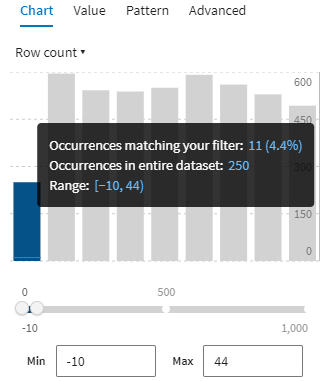
This bar represents all the occurrences of the values that are equal to or below 0.
A filter has now been applied on your data. Your preparation now only displays the lines with a value equal to or below zero for the number of rentals. You can now apply a function only on those cells.

-
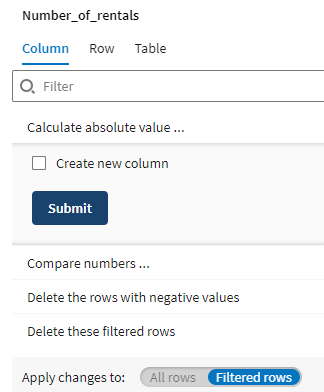
In the functions list, click Calculate Absolute
Value.
All the negative values have been converted.
Results
Did this page help you?
If you find any issues with this page or its content – a typo, a missing step, or a technical error – let us know how we can improve!