Skip to main content Skip to complementary content
Close announcements banner

Adding widgets to the dashboard

Open the monitoring page of a specific campaign and add widgets to the dashboard to interact with your data and filter on data stewards or time range. Widgets can calculate key performance indicators for a specific steward or a group of stewards.

When accessing the page for the first time, all available widgets are created by default.

Procedure

  1. Log in to Talend Cloud Data Stewardship as a campaign owner, or make sure the role assigned to you has permissions to add and manage data models and campaigns.
  2. Point to the campaign you want to monitor and click the Monitor campaign icon displayed to the right.
  3. On the campaign monitoring page, click Add a widget to open a list of the available widgets.
    Add a widget window.
  4. Select the widget you want to add to the dashboard as the following:
    Select To
    Trend in number of task resolved Show the evolution of the number of resolved tasks over time
    Trends in number of tasks not resolved before due date Show the overall evolution of the number of the tasks resolved after they were overdue
    Trends in average task resolution time Show the overall evolution in the time spent on tasks before being resolved
    Tasks resolved before due date Show the percentage of the tasks resolved before the due date
    Average task resolution time Show the average of task resolution, within the specified time range, by using a numeric value with a time unit
    Number of remaining tasks left to process Show the number of remaining tasks over the campaign
  5. Click Confirm to create the widget.

    Widgets do not have any filter by default. They apply on all data stewards and from the campaign's creation date to today

    Information noteTip: You can add multiple widgets of the same type and filter on the data to display the trends or values according to your needs.
  6. Click the Configure widget icon on the widget header.
  7. Select to filter data by data stewards or by date.
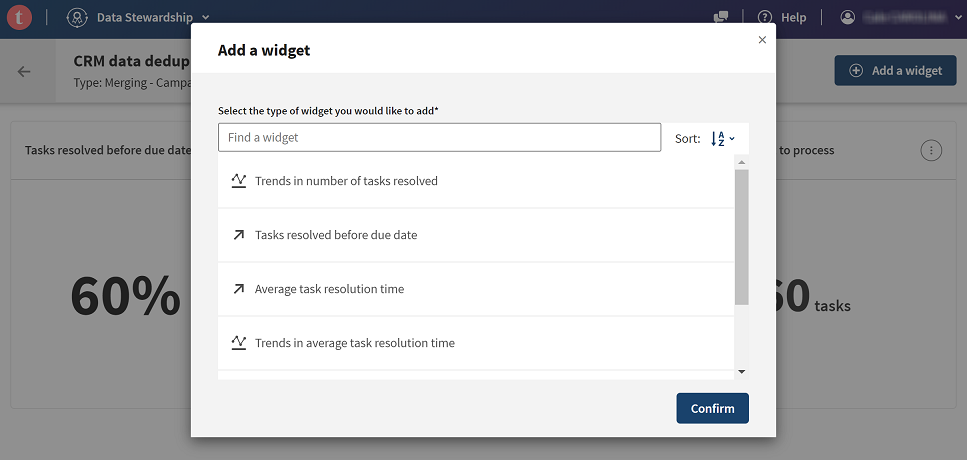
  8. Define your filter parameters and click Confirm.
    Metric data is displayed in charts to convey the trend of data over time, or reveal the percentage of tasks that were closed or the average resolution time.

    Example

    Charts in dashboard.

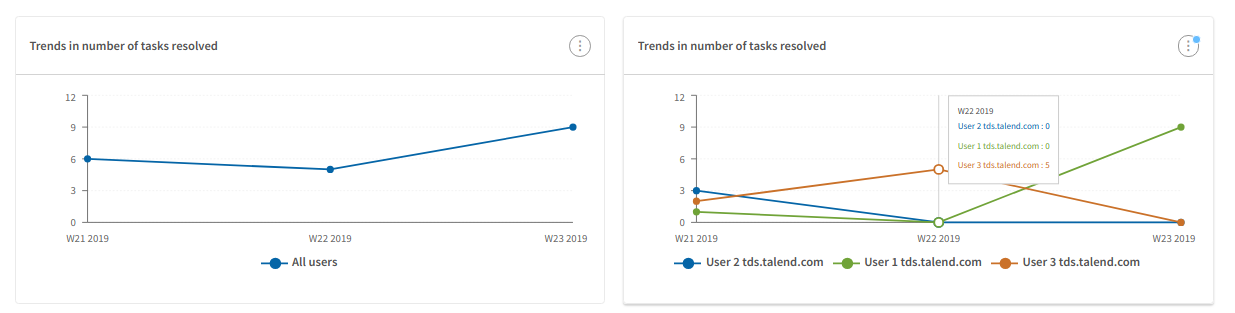
    The example widgets above show two widgets of the same type with different filters. The first shows the trends in resolved tasks for all stewards in the campaign, while the second shows the trends in resolved tasks for three specific stewards.

  9. Hover over a line or a data point in a trend widget to display in a tooltip the date and the information related to stewards performance.

Did this page help you?

If you find any issues with this page or its content – a typo, a missing step, or a technical error – let us know how we can improve!