
Monitoring the Data API server logs
The logs of the Data API server on the Remote Engine Gen2 are exposed by default and can be consumed using the docker logs command.
The logs are in json format and follow the default ECS (Elastic Common Schema) pattern. Because reading the raw JSON-structured lines would not be really helpful, you will be able to let a log management platform ingest and index the logs to visualize them more easily.
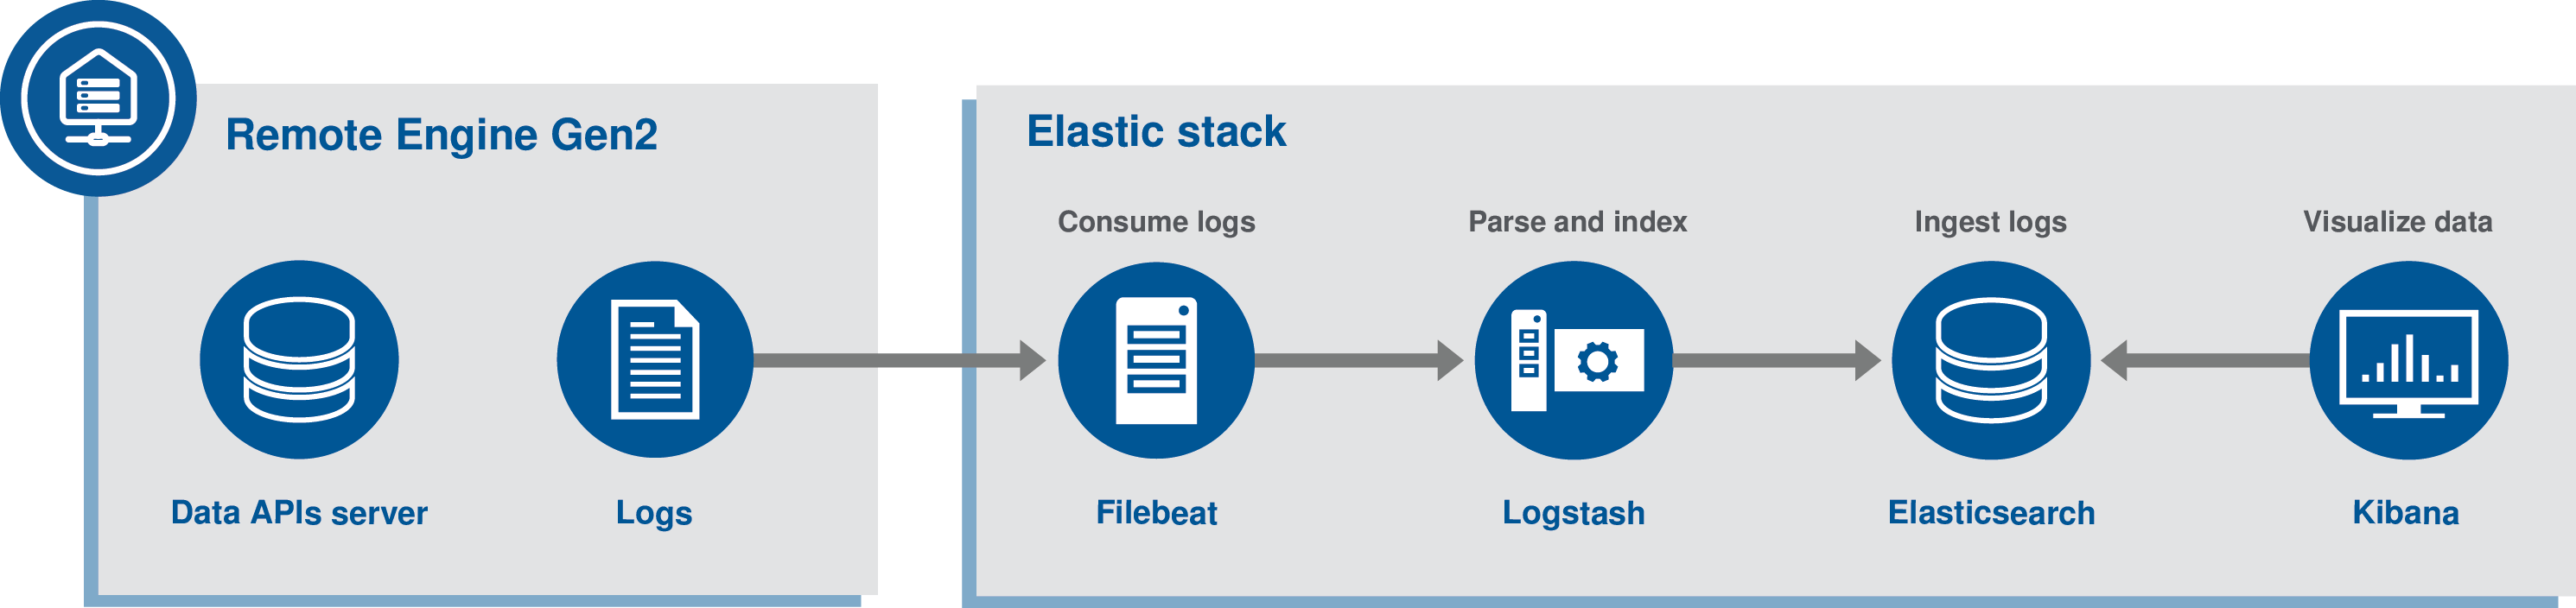
This documentation will show how to use the ELK (Elasticsearch, Logstash, Kibana) platform to retrieve and visualize the dataset-api-server logs.
The dataset-api-server container keeps track of different kinds of logs:
- The access logs of the OData APIs. Use the /apis filter in the search field to filter only the access logs.
- The probes that helps Docker tell if the container is really up and running. Use the /environment filter in the search field to filter only the probes logs.
- The synchronization logs with the Data APIs backend. Use the /synchronization filter in the search field to filter only the synchronization logs.
Before you begin
dataset-api-server:
[...]
  labels:
    autoheal: 'true'
    filebeat_ingest: 'true' # Send container logs to ELK
ELK stack
This documentation assumes that the whole ELK stack is running in its own Docker multi-containers application, on the same machine as the Remote Engine Gen2. In addition, the logs are read from the Remote Engine Gen2 by another component called Filebeat, also developed by the Elastic company, that pushes logs to the ELK stack.
This documentation is based on an ELK stack version 7.7.0.
Retrieve the api-server-monitoring.zip archive with the whole set of required files from the Downloads tab of the documentation page.
- Extract the api-server-monitoring.zip archive at your preferred location.
- In the main directory, run the docker-compose up -d command.
- Go to the following URL: http://localhost:5601.
- Go to and create the filebeat-* Kibana index pattern. Use @timestamp for time.
- The logs of the dataset-apis-server are available in the Discover section of Kibana at the following URL: http://localhost:5601/app/kibana#/discover.
If you want to stop the ELK stack, run the docker-compose down -v command in the main directory.
Filter and search logs
The dataset-api-server container keeps track of different kinds of logs:
- The access logs of the OData APIs. Use the /apis filter in the search field to filter only the access logs.
- The probes that helps Docker tell if the container is really up and running. Use the /environment filter in the search field to filter only the probes logs.
- The synchronization logs with the Data APIs backend. Use the /synchronization filter in the search field to filter only the synchronization logs.
- Configure how you want to visualize the logged data directly in Kibana.
You can sort the columns to display and highlight the information about the potential errors, severity, or the corresponding timestamp for example.
Did this page help you?
If you find any issues with this page or its content – a typo, a missing step, or a technical error – let us know how we can improve!