The Job name and the date/time (UTC) in the top left and right
respectively
The heat map: each cell represents a feature. The color shade indicates if
a feature is important in the model. The more important is the feature, the
darker is the color.
The possible values in the heat map are:
A number between 0 and 1.000 rounded off to three decimal digits
0.000: the value, for example 0.0001, is rounded to the nearest value.
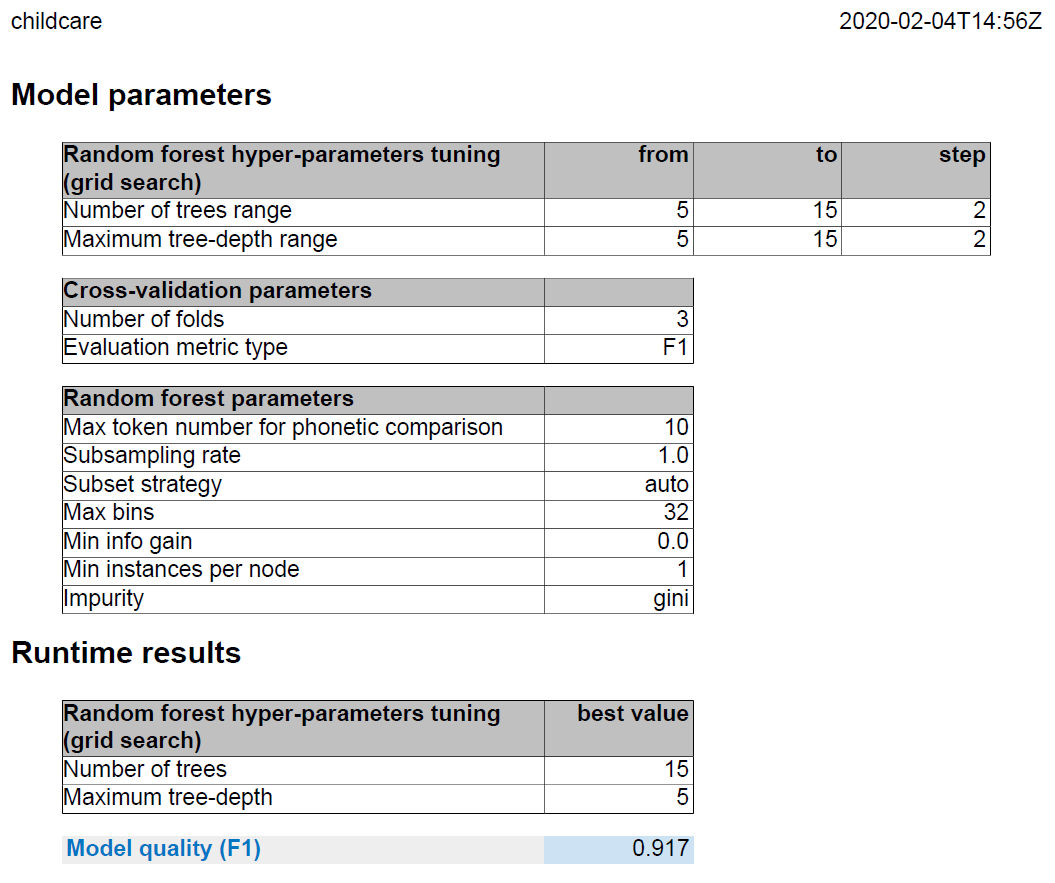
The Job name and the date/time (UTC) in the top left and right
respectively
The parameters set in the Advanced
settings tab of the tMatchModel component, including the hyper-parameters (the
number of trees and tree-depth ranges)
The number of trees for the best model
The maximum tree depth for the best model
The model quality
Did this page help you?
If you find any issues with this page or its content – a typo, a missing step, or a technical error – let us know how we can improve!