
Monitoring operations (new view)
Faceted search and filter options
-
You can filter the runs by using the drop-down lists at the top of the page to select a particular environment, workspace, task type, or operation type.
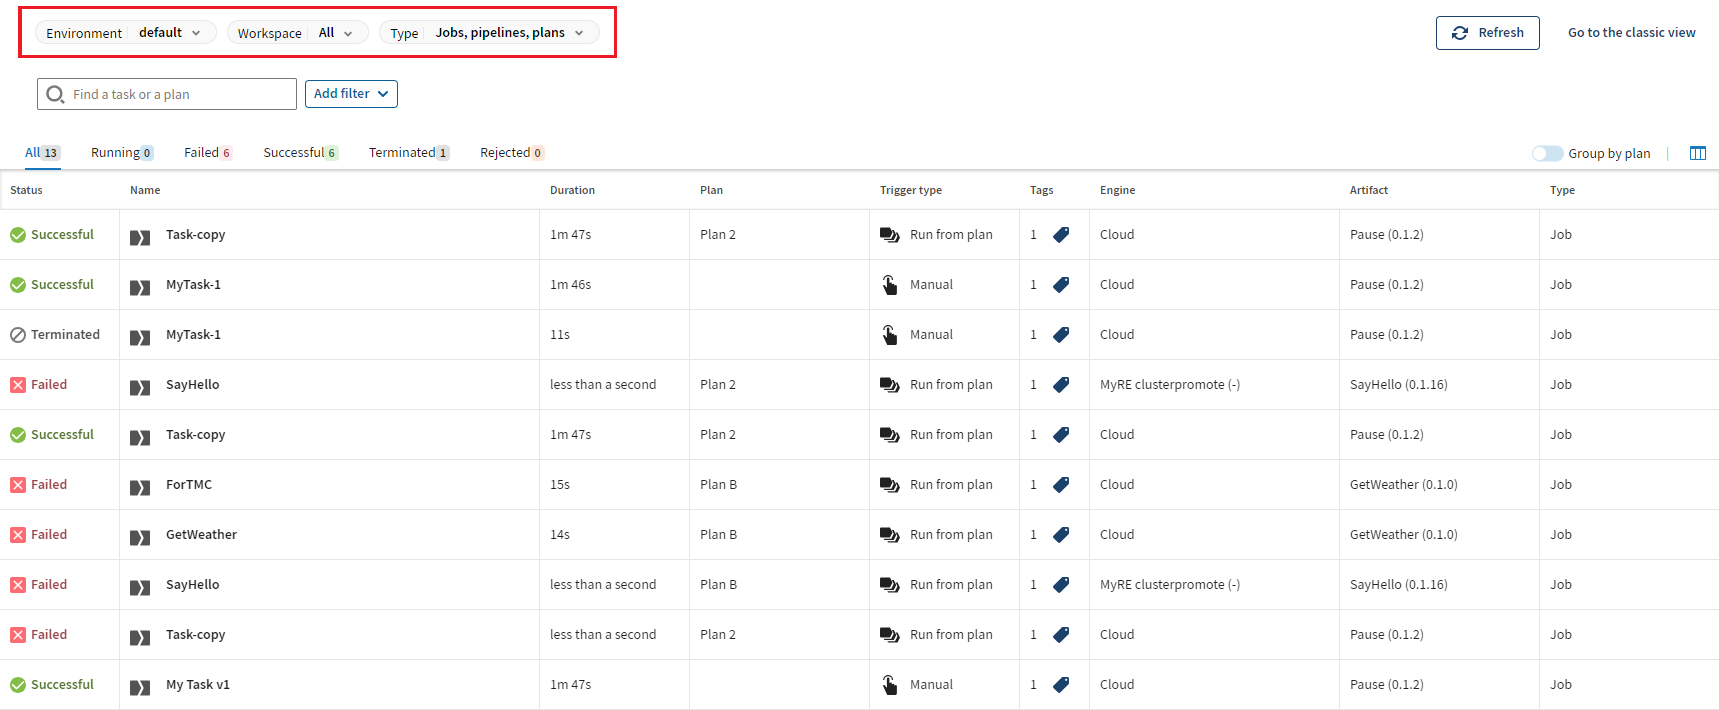
-
You can also apply the following facets to filter the list:
Filter name Description Artifact Display or hide the runs for one or more selected artifacts. You can also display or hide runs for specific artifact versions by enabling the Show all versions toggle.
Duration Display or hide the runs for which the execution time is less than or greater than a selected duration. The default value for the Less than operator is 60 minutes. You can enter a maximum of three characters in each field, for example >120 min.
This filter is only available for Job or pipeline tasks and plans.
Engine Display or hide the runs related to one or more selected engines. Name Display or hide the runs for one or more selected tasks. Period Display or hide the runs for a selected period. You can select a predefined period or define a custom period by selecting a start or/and end date.
Plan Display or hide the runs for one or more selected plans. This filter is only available for Job or pipeline tasks and plans.
Tags Display or hide the runs associated with one or more selected tags. You can apply a facet only once.
You can use the faceted search to display specific runs by using the In operator or to exclude and hide specific ones from the list by using the Not in operator.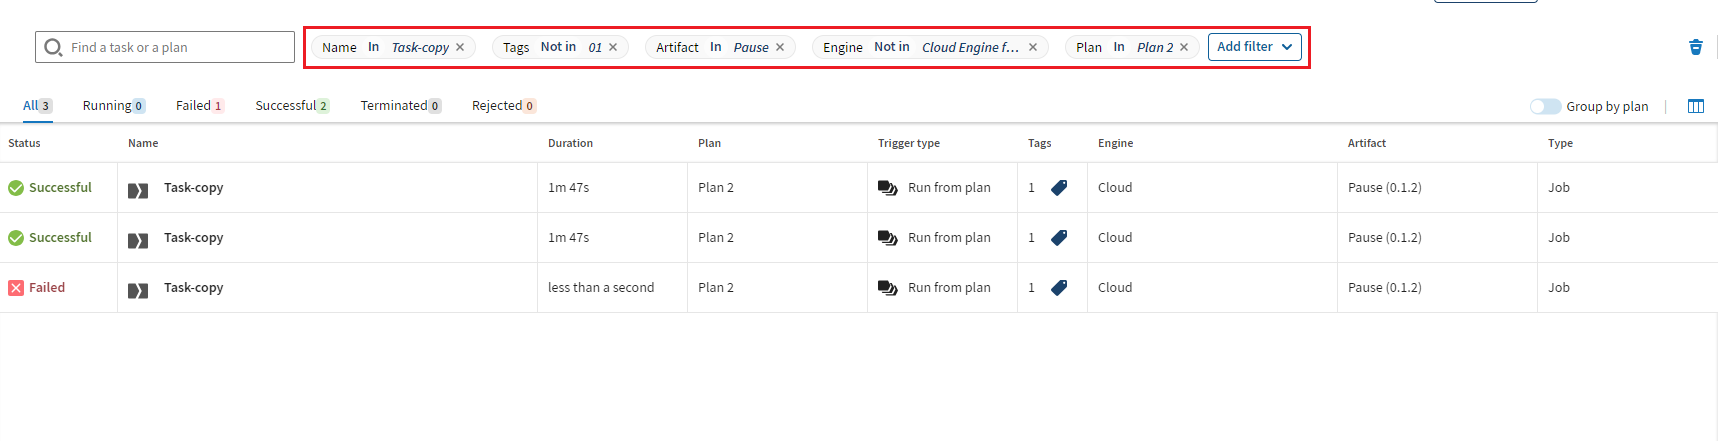
-
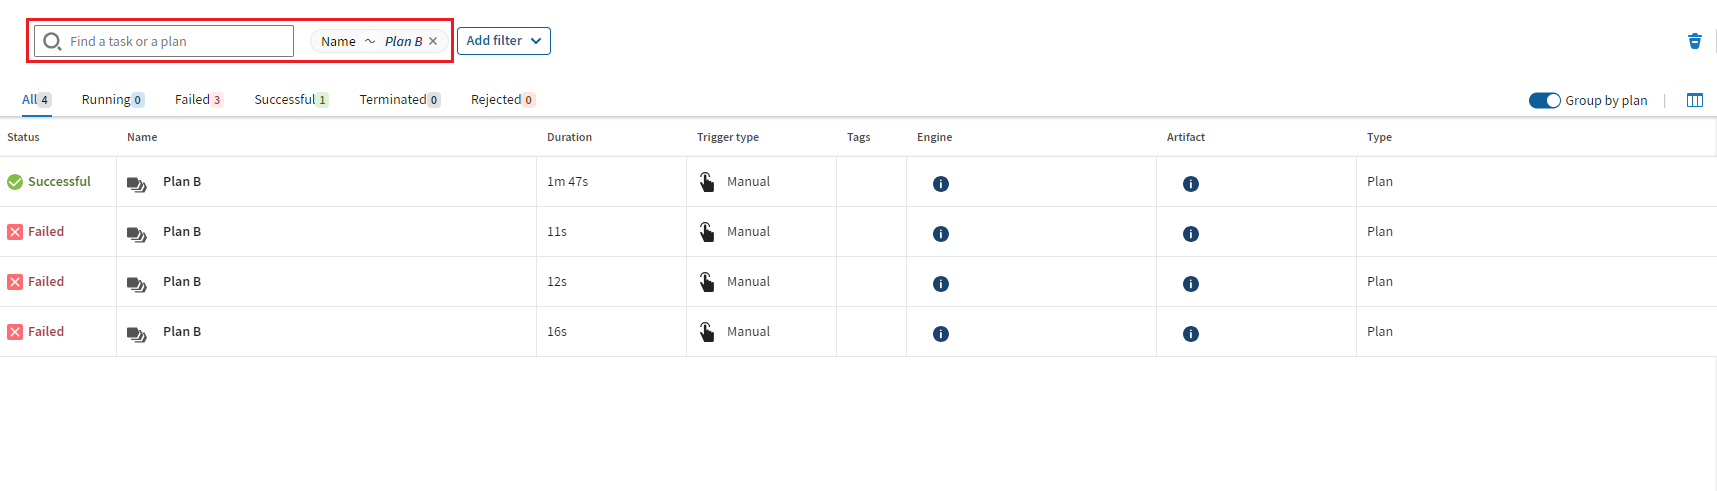
You can perform a quick search on a plan or task name.
You must enter at least three characters in the search box.
Run status tabs
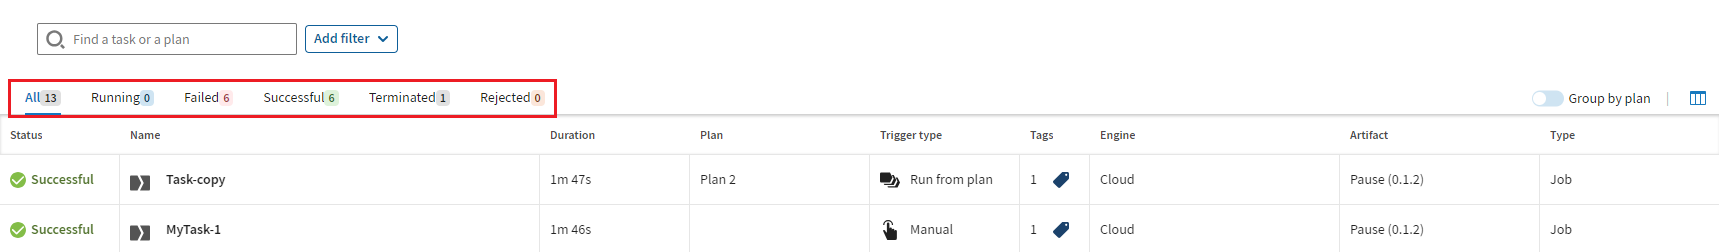
- Manually means the run has been terminated manually by a user.
- Timed outmeans the run has been terminated due to a task or trigger timeout.
- Engine stopped means the run has been terminated due to a graceful engine shutdown.
Group by plan toggle
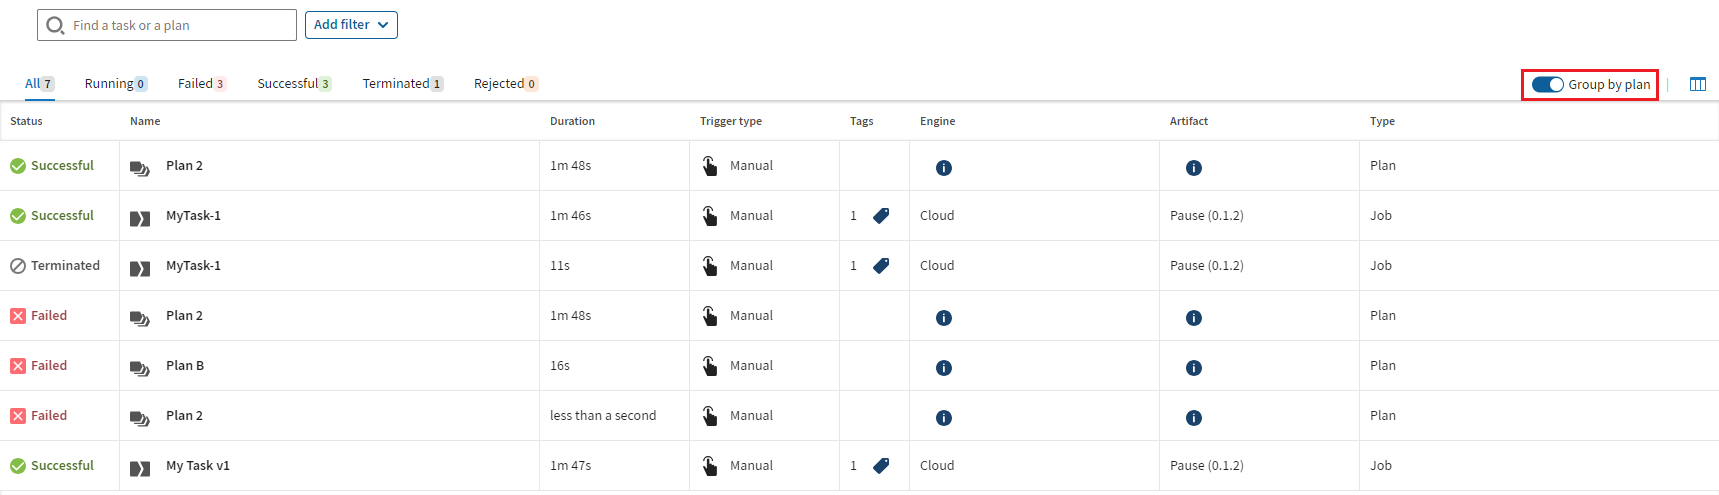
The plans must be run at least once.
You must have the appropriate permissions on the workspace where the plan is located if the task and plan are not in the same workspace.
Column chooser
 icon in the top-right corner, you can select what information to
display in the table.
icon in the top-right corner, you can select what information to
display in the table.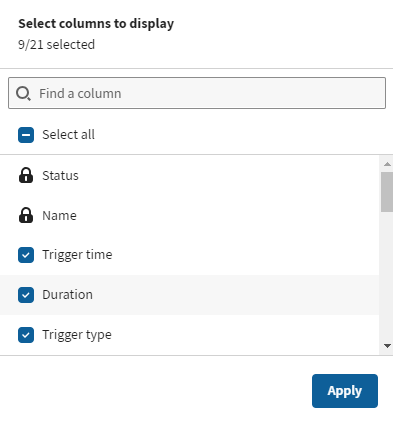
- Monitor Job, pipeline, Route, and data service task runs
- Monitor task runs that are part of a plan in a single plan entry
- View the status, name, trigger time, duration, and trigger type of a task or plan run
- View the error message of failed runs by clicking the information button in the Error column, as well as which step failed in a plan
- View the version of the task executed
- View the used execution engine type or name and which engine was used for the steps in a plan
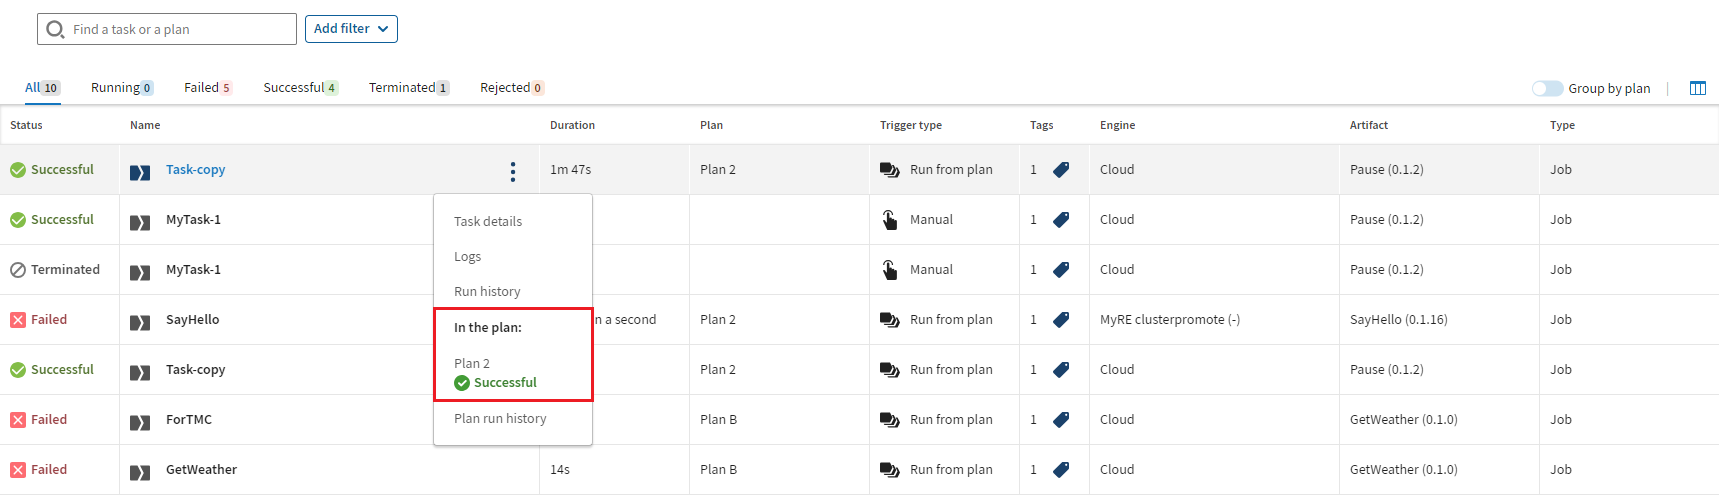
- Access the task details page by clicking
 > Task details
- Access the plan details page by clicking
> Plan details
- Access the execution logs of individual operations by clicking
> Logs
- Access the run history of the task or plan by clicking
> Run history
- Access the run history of the plan under which a task is processed by clicking
> Plan run history.
Did this page help you?
If you find any issues with this page or its content – a typo, a missing step, or a technical error – let us know how we can improve!