
Viewing the component metrics
Before you begin
You have published or republished the Jobs with Talend Studio version 8.0.1 or 7.3.1 with the latest update.
This feature is available for Cloud Engine and Remote Engine 2.12.0 onwards.
About this task
Data older than 31 days will be cleared automatically as per our metrics retention policy.
Metrics are automatically refreshed.
Procedure
-
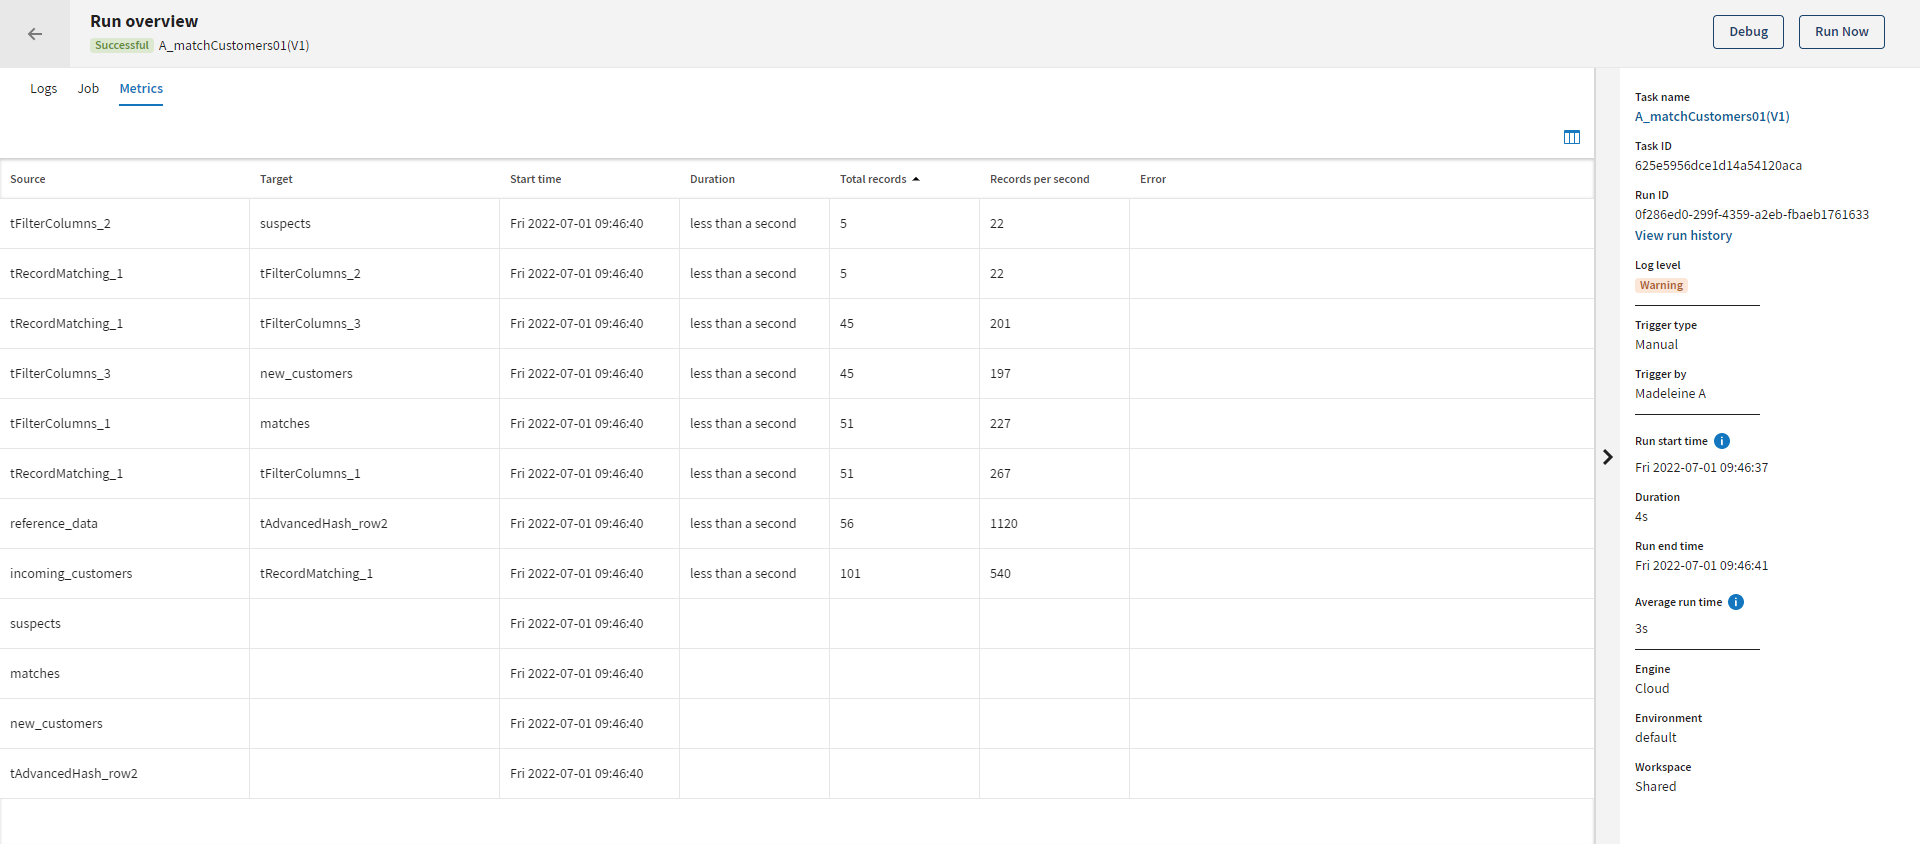
Open the Metrics tab.
 You can click the
 icon in the top-right corner to select what
information to display in the table. By default, the columns
Source, Target,
Start time, Duration,
Total records, Records per
seconds and Error are displayed.
icon in the top-right corner to select what
information to display in the table. By default, the columns
Source, Target,
Start time, Duration,
Total records, Records per
seconds and Error are displayed.
You can sort the data based on the columns Start time, Duration, Total records or Error by clicking on the column header. By default, the data is sorted with the latest on top. You can use only one column at a time.
Did this page help you?
If you find any issues with this page or its content – a typo, a missing step, or a technical error – let us know how we can improve!