Skip to main content Skip to complementary content

Defining the columns to be analyzed in a file

The first step in analyzing the content of one or multiple columns is to define the columns to be analyzed. The analysis results provides statistics about the values within each column.

When you select to analyze Date columns and run the analysis with the Java engine, the date information is stored in the Talend Studio and in the data mart as regular date/time of format YYYY-MM-DD HH:mm:ss.SSS for date/timestamp and of format HH:mm:ss.SSS for time. The date and time formats are slightly different when you run the analysis with the SQL engine.

Before you begin, you have defined at least one connection to a delimited file the Profiling perspective of Talend Studio.

Defining the column analysis

Procedure

  1. In the DQ Repository tree view, expand the Data Profiling folder.
  2. Right-click the Analyses folder and select New Analysis.
    Contextual menu of the Analyses node.

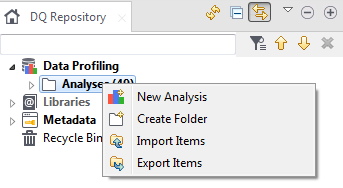
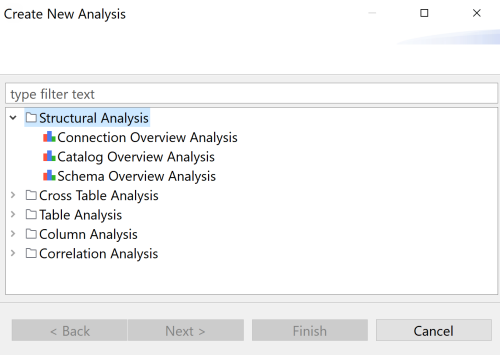
    The Create New Analysis wizard opens.

    Create new analysis wizard
  3. In the filter field, start typing basic column analysis, select Basic Column Analysis and click Next.
  4. In the Name field, enter a name for the current column analysis.
    Information noteImportant:

    Do not use the following special characters in the item names: ~ ! ` # ^ * & \\ / ? : ; \ , . ( ) ¥ ' " « » < >

    These characters are all replaced with "_" in the file system and you may end up creating duplicate items.

  5. Set column analysis metadata (Purpose, Description and Author) in the corresponding fields and click Next.

Selecting the file columns and setting sample data

Procedure

  1. Expand FileDelimited connections and in the desired file, browse to the columns you want to analyze.
    In this example, you want to analyze the id, first_name and age columns from the selected connection.
  2. Select the columns and then click Finish to close the wizard.
    A file for the newly created column analysis is listed under the Analysis node in the DQ Repository tree view, and the analysis editor opens with the analysis metadata.
    Overview of the Data Preview section.
  3. In the Data preview view, click Refresh Data.
    The data in the selected columns is displayed in the table.
    You can change your data source and your selected columns by using the New Connection and Select Columns buttons respectively.
  4. In the Limit field, set the number for the data records you want to display in the table and use as sample data.
    For example, 50 records.
  5. Select n first rows to list the first 50records from the selected columns.
  6. In the Analyzed Columns section, use the arrows in the top right corner to open different pages in the view if you analyze large number of columns.
    You can also drag the columns to be analyzed directly from the DQ Repository tree view to the Analyzed Columns list.
  7. Use the delete, move up or move down buttons to manage the analyzed columns.
  8. If required, right-click any of the listed columns in the Analyzed Columns section and select Show in DQ Repository view to locate it in the database connection in the DQ Repository tree view.

Did this page help you?

If you find any issues with this page or its content – a typo, a missing step, or a technical error – please let us know!