
General Troubleshooting
For any issue when you see something unexpected
Steps
- Apply the latest MM Cumulative Patch (and make sure Database Script has run long enough)
- Go to MANAGE > System and select Enable in the Debug Logging pull-down and then reproduce the issue.
- Open the process log and be sure to select Show: All. Then, make any changes specified in the log messages.
- In addition, if you see an error reported like this:
“…please contact your system administrator”
The details may be in the System Log and are likely to be debug level messages.
Get the Debug level system log by going to
- Go to MANAGE > System and select Enable in the Debug Logging pull-down.
- Reproduce the issue.
- Go to MANAGE > System and select Disable in the Debug Logging pull-down.
- Analyze the debug level messages from the time the issue was reproduced.
Debug level messages are not shown in MANAGE > System Logs, nor is it part of the download there. Instead, when you enable debug logging, those messages are written to the Tomcat server logs (catalina.log) on the application server machine. You may find this file in the installation directory at
$MM_HOME/data/logs/tomcat/
Now, since a restart resets the level, if the issue is related to something that happens on server start, you must do something special and enable debug logging on startup by editing the $MM_HOME/conf/conf.properties file and setting the MIR_LOG_LEVEL to 6. The line should be uncommented, and the value changed from 5 to 6. Then restart the application server and capture the $MM_HOME/data/logs/tomcat/catalina.log file.
Explorer Further
UI Troubleshooting
For any issue where you see something unexpected in the UI, please perform the following steps.
Steps
- Stop Talend Data Catalog service on the server machine and run Talend Data Catalog as a desktop app by selecting Start -> All Programs -> Meta Integration -> Server Restart.
- Close all instances of the web browser you are using.
- Check that the browser and Adobe Flash are updated to the latest patches.
- Open an instance of the browser.
- Clear the cache and recent history on the web browser:
- go to _MANAGE > Configuration > Update and Build > Clean Build_
- Press F12 to use the developer tools
- RIght click on the browser refresh button and select Empty cache and hard reload
- Close all instances of the web browser.
- Open the browser and reconnect to Talend Data Catalog .
- Remove any zoom effects on the browser, generally by using Ctrl-0.
For any issue where you see something unexpected when importing a model, please perform the following steps.
The bridges do not use log4j and does not log into the tomcat log file but in its own set of files. Thus, one cannot go to the data/logs/tomcat folder for import (or export) logs.
Steps
- Review the tool tips (help) for the bridge in general and each bridge parameter individually to ensure that the bridge is being used correctly.
- Open the import (or export) log and be sure to select Show: All. Then, make any changes specified in the log messages.
- Stop Talend Data Catalog service on the server machine and run Talend Data Catalog as a desktop app by selecting Start -> All Programs -> Meta Integration -> Server Restart. If this step resolved the problem, you will need to configure the service to have the proper credentials. More details may be found in the deployment guide:
- Step (3.) in section (5.1) “Default install on Windows with bundled Tomcat”
- All the steps in section (6.) “MIMB (Metadata Harvesting)”.
- Clear the import cache directories on the application server machine at:
$MM_HOME/data/MIMB/cache
- Go to MANAGE > System and select Enable in the Debug Logging pull-down.
- For any import bridge issues, go to MANAGE > Configuration, select the model, click IMPORT
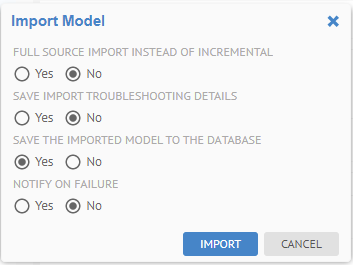
- and specify:
- FULL SOURCE IMPORT INSTEAD OF INCREMENTAL
- SAVE IMPORT TROUBLESHOOTING DETAILS
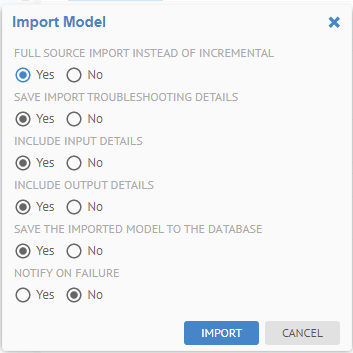
The SAVE IMPORT TROUBLESHOOTING DETAILS selection causes a debug package to be produced. This package is a zip file that contains the artifacts required to reproduce the issue. Without this information, it may be impossible to reproduce and thus resolve a reported issue. Also, the dialog will change providing additional options. Please be sure to specify INCLUDE INPUT DETAILS and INCLUDE OUTPUT DETAILS.

- Open the log when the import is completed and click Download troubleshooting details.
For any issue where you see something unexpected and neither of the above have resolved the issue.
Steps
- Ask the system administration staff to review the installation and configuration steps deployment guide, especially the sections covering installation and testing of the Application Server and software.
When reporting an issue, there is some information you should collect beforehand.
Steps
- Sign in as a user with at least the Application Administratorcapability global role assignment.
- Get the Application Server and Database Server Details by going to either:
- Go to MANAGE > System
- Click Download (top right) to obtain a TXT file of the application and database server Information
- Click Operations (top left) > Get repository content statistics (run script and save log)
- Click Operations (top left) > Test performance (run script and save log)
- Get the Database Maintenance Status by going to either:
- Go to MANAGE > Schedules
- Select the schedule (top panel) Run Database Maintenance
- Select the latest execution in the History (bottom panel) and click View Log (on the right)
- In the Log Messages dialog, click on Show All (bottom), and Save
- Get the Repository Content Statistics for (each) Configuration by going to:
- Go to Objects > Statistics In the banner, click on Download (top left) the CSV file of the configuration statistics.
- Get the System Log by going to
- Go to MANAGE > System and select Enable in the Debug Logging pull-down.
- Reproduce the issue to report
- Go to MANAGE > System and select Disable in the Debug Logging pull-down.
- Zip up the debug logs and attach to the ticket.
Debug level messages are not shown in MANAGE > System Logs, nor is it part of the download there. Instead, when you enable debug logging, those messages are written to the Tomcat server logs (catalina.log) on the application server machine. You may find this file in the installation directory at
$MM_HOME/data/logs/tomcat/
And zip the catalina.log file up and provide it with the ticket.
Now, since a restart resets the level, if the issue is related to something that happens on server start, you must do something special and enable debug logging on startup by editing the $MM_HOME/conf/conf.properties file and setting the MIR_LOG_LEVEL to 6. The line should be uncommented, and the value changed from 5 to 6. Then restart the application server and capture the $MM_HOME/data/logs/tomcat/catalina.log file.
- For any import bridge issues, go to MANAGE > Configuration, select the model, click IMPORT

- and specify:
- FULL SOURCE IMPORT INSTEAD OF INCREMENTAL
- SAVE IMPORT TROUBLESHOOTING DETAILS

The SAVE IMPORT TROUBLESHOOTING DETAILS selection causes a debug package to be produced. This package is a zip file that contains the artifacts required to reproduce the issue. Without this information, it may be impossible to reproduce and thus resolve a reported issue. Also, the dialog will change providing additional options. Please be sure to specify INCLUDE INPUT DETAILS and INCLUDE OUTPUT DETAILS.

- Open the log when the import is completed and click Download troubleshooting details.
- Attach the debug package (zip file downloaded) to the ticket.
- Finally, if it a UI issue and you are requested to, please use the below steps to capture the .HAR file.
The are the instructions for Google Chrome. Other browsers have similar capabilities.
- Open Chrome
- Go to the Customize and Control Google Chrome options menu and select More tools… > Developer Tools or simply press F12
- Go to the Network tab
- Reproduce the issue
- Click the on Export HAR (down pointing arrow)
- Save the file
- Attach to the ticket.
Did this page help you?
If you find any issues with this page or its content – a typo, a missing step, or a technical error – let us know how we can improve!