
Data Flow
You may use the Data Flow tab for different use cases and scope:
- You may invoke a lineage and/or impact trace by going to the Data Flow tab or context menu from a classifier (table, file, entity, etc.) or feature (column, field, attribute, etc.) which will present an end-to-end trace across all the models and mappings in your current configuration
- You may invoke a lineage overview by going to the Data Flow tab from the detail page for a model, schema, ETL job, BI design, etc. which will present lineage within the model, even without stitching them to other models
Either use case may be displayed from the model / data store / schema high level perspective of the enterprise architecture, down to the table / file level, and finally all the way down at the column / field level. The level can be selected for the entire data lineage diagram, or individually on selected data store models / schemas, or selected tables / files.
In the Data Lineage Diagram, all columns/fields of a given table/file are presented at once which matches the classic data modeling concepts. Selection of a given column/field allows a user to highlight the data flow to it.
However, in the past, these diagrams can be overly crowded in today's data lake architectures where it is common to find tables/files with over hundred columns/fields. Furthermore, the large number of tables/files involved may generate too many objects in a readable graph, giving rise to possible warning in the user interface.
You now have the option (by default) of using the data flow "interactive" Analysis Diagram, which displays the columns/fields involved in the given data flow trace, not all the columns. The user can then select the columns/fields to be displayed to better present the business use case of that data flow. Then the user can interact within that diagram by selecting columns/fields to display its lineage. Furthermore, the Analysis Diagrams allow you to display conditional labels such as PII or Confidential SensitivityLevel, not only providing more critical information to the user, but also better visualization of the propagation of that information (e.g. PII) through the data flow lineage trace.
Data Flow Lineage Trace
This method of analysis presents either graphical or textual representation of the flow of data through connection definitions to data stores and physical transformation rules which transform and move the data. In order to see data flow lineage, one must
- Define a configuration that contains all of the models potentially in the data flow
- Stitch the models together by resolving connection definitions and Build the configuration
Once the configuration is ready, then you are ready to report on lineage.
In the Data Lineage Diagram, all columns/fields of a given table/file are presented at once which matches the classic data modeling concepts. Selection of a given column/field allows a user to highlight the data flow to it.
End-to-end data flow lineage across models is only available at the classifier (e.g., table) and feature (e.g., column) level. If instead one goes to the object page for a schema or model, as this is not classifier or feature, the data flow tab shows the overview lineage within the scope of that model only.
A data flow lineage trace presents summary lineage as opposed to the data flow overview lineage which presents a step by step transformation lineage.
When you trace impact/lineage of a table or column, you do not see all the transformations. Instead, you see a summary of the whole job (you get a picture much closer to the one for an architecture diagram). But, you are also able to see complete end-to-end lineage (not just confined to one DI or BI model).
Finally, the tool does not display constants on the lineage diagram. In particular, this means that if a constant appears as a source for lineage and that process only has that constant as a source for a lineage trace, you will not see that process in the lineage trace.
Steps
- Sign in as a user which has at least the Metadata Viewing or Data Managementcapability object role assignment to the configuration and all its contained models.
Without the Metadata Viewing capability object role assignment to all the configuration’s contained model, you will see a dialog indicating that you do not have sufficient privileges.
- Find a starting point for lineage by either
- Navigating to that element’s object page and select the Data Flow tab
- Or, for lists of elements, click the line the element is on and click the appropriate Trace Data Flow icon
- Or, right click on the element in a diagram (architecture diagram, lineage diagram or model diagram) and select Trace Lineage > Data Flow
- From here you may
- Use the common lineage trace functions
- Specify the lineage presentation
- Data flow Tree
- Data flow Diagram
- Data flow Classic Diagram
- Switch to
- Data Lineage - trace from an object upstream to objects that provide data flow to that object
- Data Impact - trace from an object downstream to objects that are impacted via data flow by that object
- Full Data Lineage - Both of the above.
Select the Tree tab on the left to obtain this presentation.
Next to SHOW, you will see a list of objects or processes:
- Objects data store object types, e.g., tables, columns, views, fields, files, etc.
- Processes data movement and possibly transformation processes, e.g. mappings, transformations, computation, select/inserts, etc.
The scope of that list is based upon the choice of direction of the trace which are impact (forward) or lineage(sources) or the business intelligence (BI) reports, as well as the proximity in the trace:
- Adjacent objects/processes in the lineage which are the next items in a lineage trace. For impact, that can often be the data store (like a warehouse) that is the target of an object being loaded by DI/ETL that is the focus of the lineage. For course lineage, it can often mean the data source directly loaded from to produce the object that is the focus of the lineage.
- Ultimate end objects/processes are the final nodes in the lineage where the trace stops. For impact, this often means report fields, for source lineage it often means operational system tables and columns.
- Reports objects/projects in the lineage which are part of the business intelligence type reports generally at the far end of the lineage trace.
- All objects/projects in the lineage which are part of the business intelligence type reports generally at the far end of the lineage trace.
Steps
- Trace data flow lineage.
- Click the Tree tab on the left.
- From here you may
- Pick the options next to SHOW in the upper left, as defined above.
- Click the Download icon to download the entire textual results to CSV format.
- Expand the details panel to see an equivalent of the Overview tab for the object page of a selected object or process.
Example
Data Flow Tree Objects
Search for the DW Staging.Customer table, go to the object page and then the Data Flow tab. Click the Tree tab on the left. Click Objects and Ultimate next to SHOW.

The Lineage (Sources) panel shows the Customer table in the Accounting.MITI-Finance-AR datastore along with the two files in the Data Lake, which together comprise the ultimate sources for this Customer table in Staging DW.
The Impact (Destinations) panel shows the ultimate reports using data from the Customer table.
Click Adjacent.

The Lineage (Sources) panel still shows the Customer table in the Accounts Receivable model as it was not only the ultimate source for this table in Staging DW, but also was the adjacent one.
The Impact (Destinations) panel shows the tables in the Dimensional DW data store, instead of going to the ultimate destination, which were the reports.
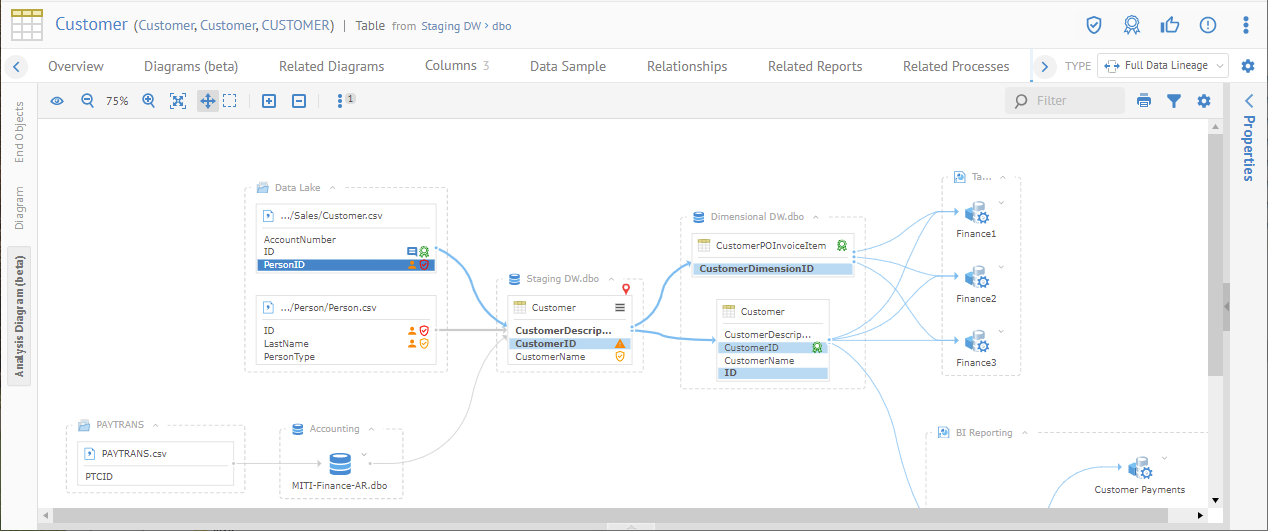
Now, click the Diagram tab on the right to see the full picture of the lineage.

Now, one can see that why the similar results on the Lineage (Sources) panel as there is really only one step (adjacent) to the ultimate sources.
This example is a fairly simple demo. One can imagine the value of using the Tree tab for more realistic (and then much more complex) lineage examples from real environments.
Return to the Tree tab and click Ultimate.

Expand the Details panel on the far right and select the Finance1 app in the Qlik Sense Cloud model.

Now we see a representation of the contents of the Overview tab of the object page, but presented as a panel in the lineage display.
You may now click on the Open in Tool as in the examples with BI tools further in the user guide.
Data Flow Tree Processes
Now click Processes.
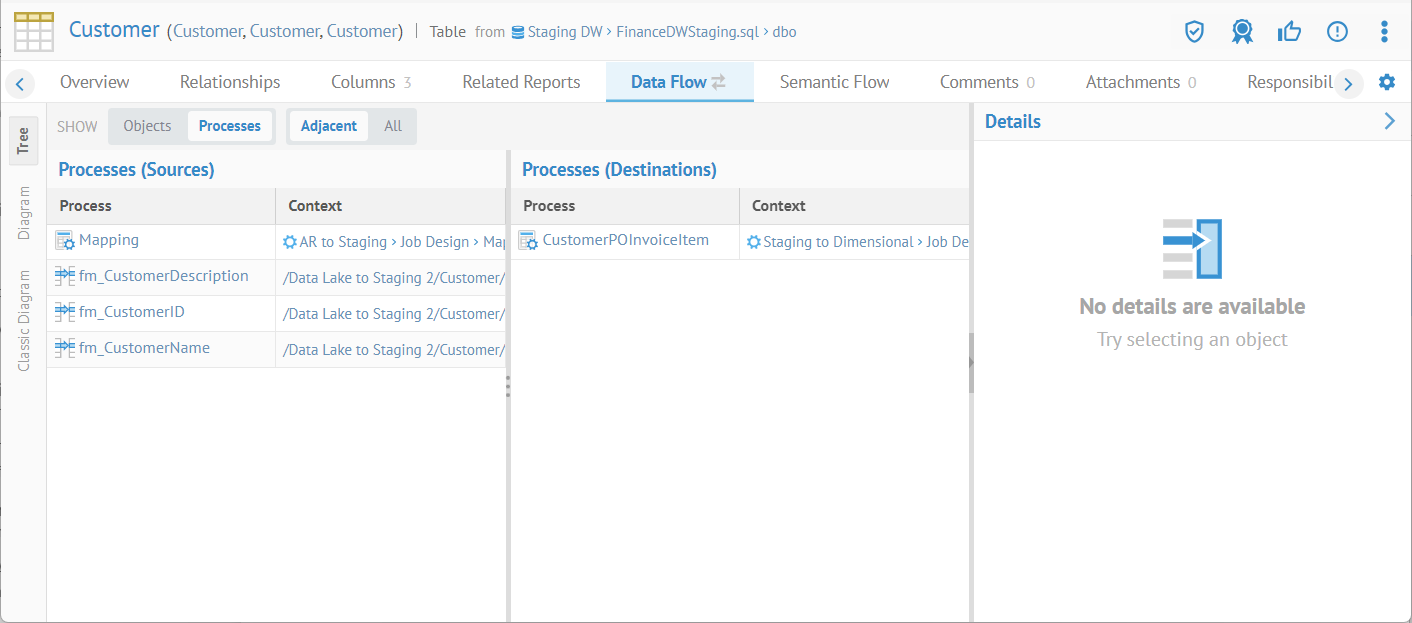
There are four processes that are immediately before in the data flow and one process immediately after.
Click the first item in the Processes (Sources) list, which is named Mapping.
This precursor process is actually Talend DI process reading from the accounts receivable operational data store and writing to the Staging DB (for which we were looking at the lineage).
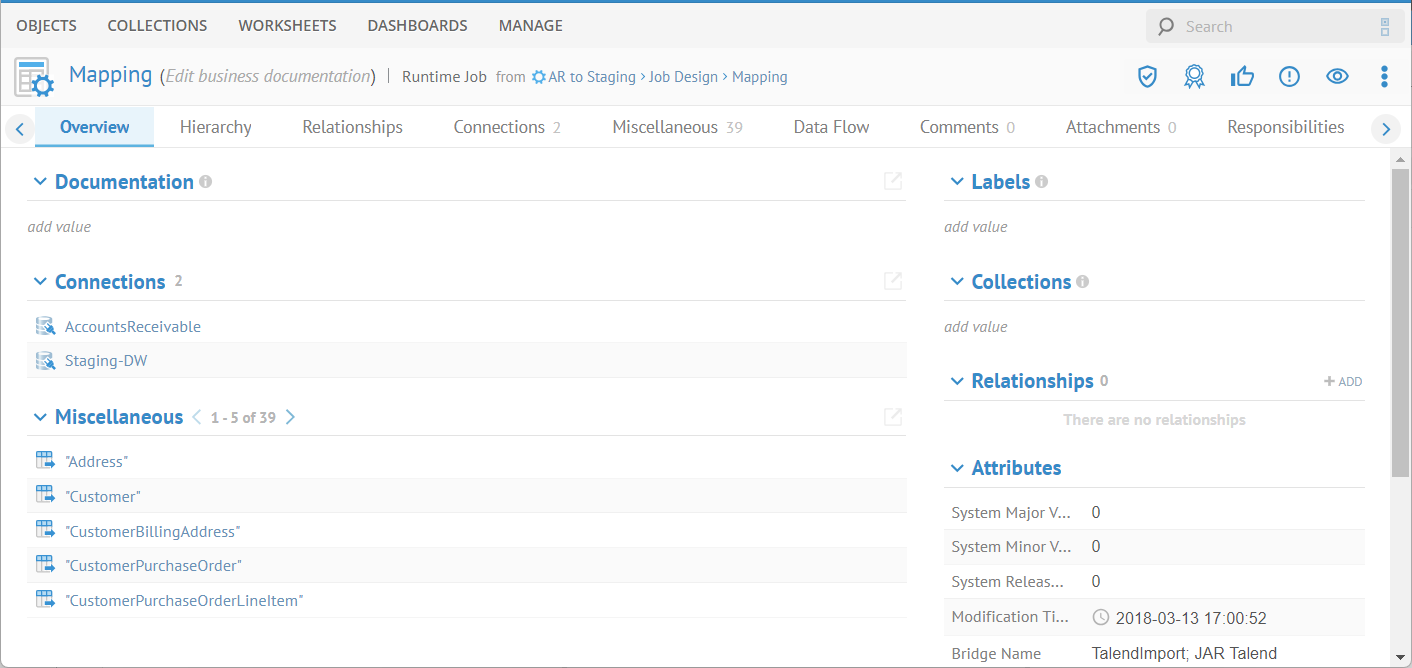
Go to the Data Flow tab for this process to produce an overview lineage diagram for that process:
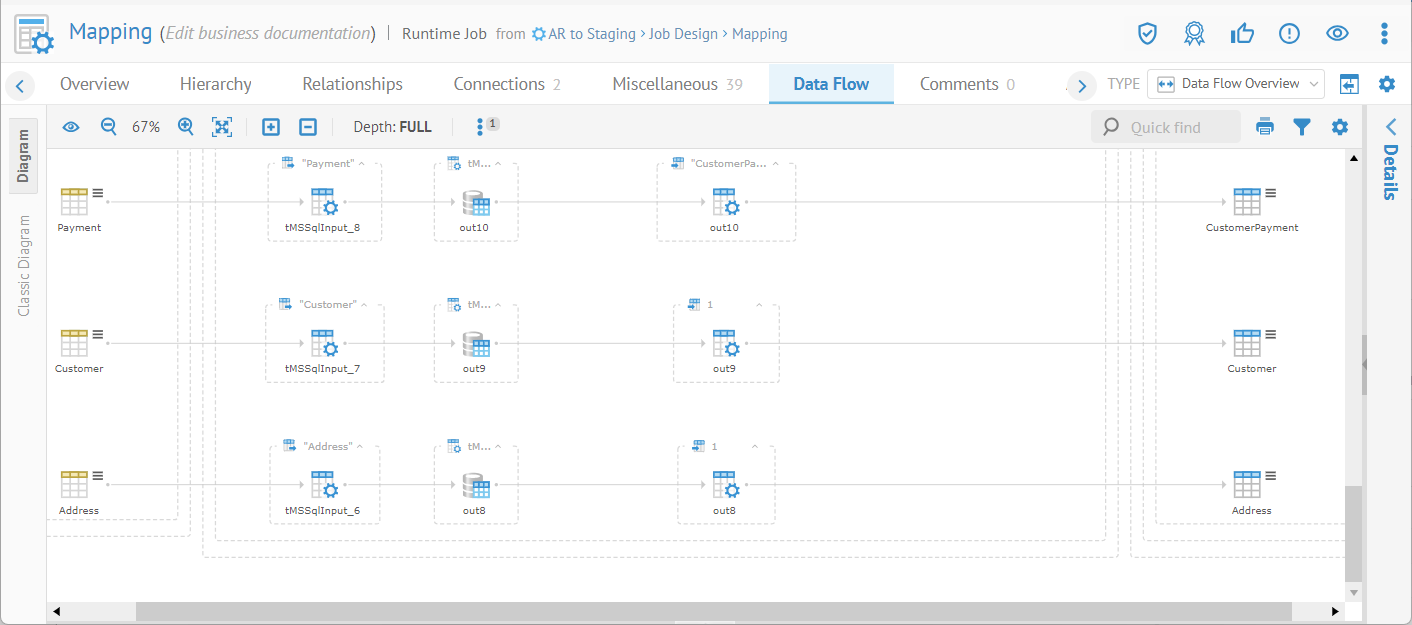
This process includes a number of parallel pipelines to various tables in Staging DW, including the Customer table.
As it is a data flow overview diagram (not a lineage trace), there are several pipelines shown, but the scope is just within the DI/ETL model.
Click the Back arrow in the browser to return to the original Tree based lineage trace.
Data Flow Diagram
The Classic Data Lineage Diagram can be overly crowded in today's data lake architectures where it is common to find tables/files with over hundred columns/fields. Furthermore, the large number of tables/files involved may generate too many objects in a readable graph, giving rise to possible warning in the user interface.
The data flow "interactive" Analysis Diagram displays the columns/fields involved in the given data flow trace, not all the columns. The user can then select the columns/fields to be displayed to better present the business use case of that data flow. Then the user can interact within that diagram by selecting columns/fields to display its lineage. Furthermore, the Analysis Diagrams allow you to display conditional labels such as PII or Confidential SensitivityLevel, not only providing more critical information to the user, but also better visualization of the propagation of that information (e.g. PII) through the data flow lineage trace.
The data flow analysis diagraming feature presents a graphical representation of the flow of data through connection definitions to data stores and physical transformation rules which transform and move the data. In order to see data flow lineage, one must
- Define a configuration that contains all of the models potentially in the data flow
- Stitch the models together by resolving connection definitions and Build the configuration
Once the configuration is ready, then you are ready to report on lineage.
End-to-end data flow lineage across models is only available at the classifier (e.g., table) and feature (e.g., column) level. If instead, one goes to the object page for a schema or model, , as this is not classifier or feature, the data flow tab shows the overview lineage within the scope of that model only.
Steps
- Trace data flow lineage.
- Click the Analysis Diagram tab on the left side.
- From here you may
- Pick the Direction in the pull-down in the header of the diagram:
- Impact (Destination) direction
- Lineage (Sources) direction
- Any type for both data impact and lineage.
- Select which columns to display in the diagram using the Columns pull-down in the header of the diagram.
- A list of possible columns with a quick find is presented with checkboxes.
- Pick the Depth in the pull-down in the upper right.
- 1 (Adjacent) step in the lineage. Objects in the lineage that are the next items in a lineage trace.
For impact, adjacent can often be the data store (like a warehouse) that is the target of an object being loaded by DI/ETL that is the focus of the lineage. For course lineage, it can often mean the data source directly loaded from to produce the object that is the focus of the lineage.
- 2 thru 9 steps in the lineage
- Any type for both data impact and lineage.
- Click the Show actions for the selected object icon and
- Select Show/Hide Columns to show columns in the selected object, or all objects if none is selected.
- Select Expand/Collapse All to expand the display of the selected object down to the current display level (columns or tables) or collapse to the highest level. Applies to all objects if none is selected.
- Click Save an image to produce a downloadable file with a lineage image.
- Click Filters and specify lineage filter options.
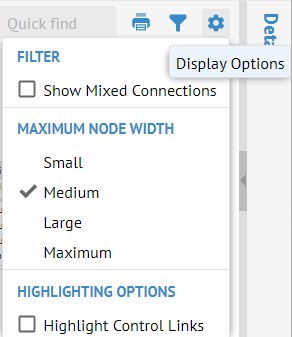
- Click Display Options and specify lineage display options.
Example
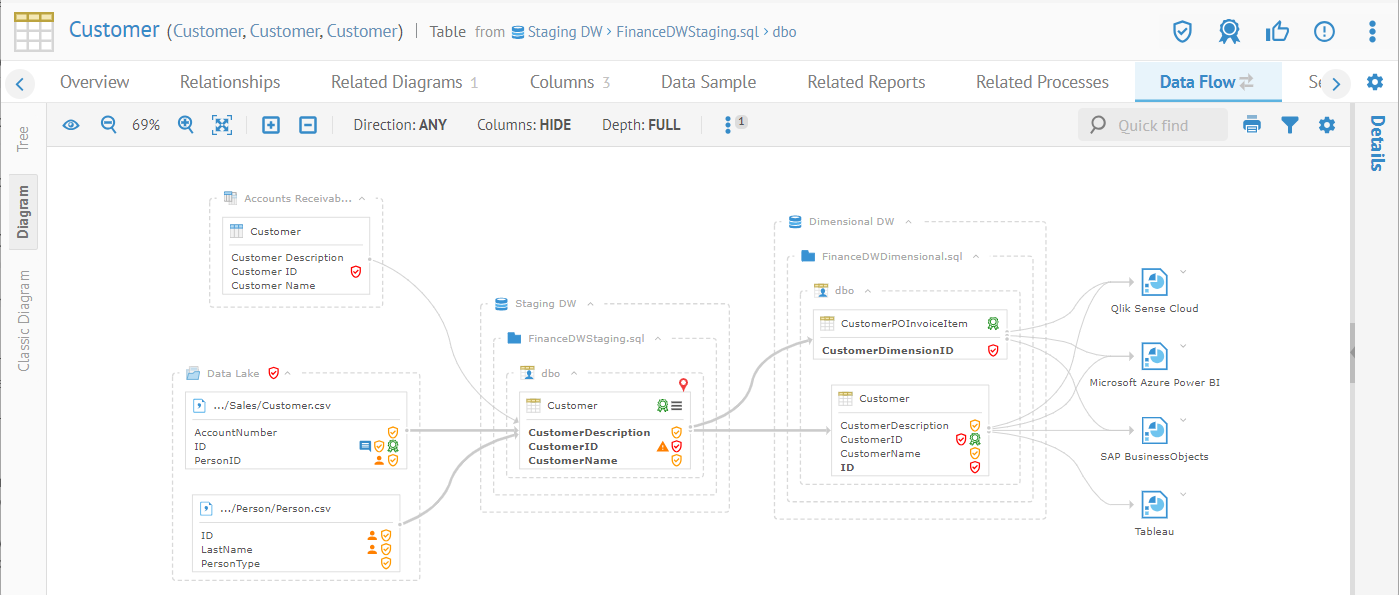
Navigate to the object page for the Customer table in the Staging DW.dbo schema.
Go to the Data Flow tab and click the Diagram tab on the left side.
Pick ANY for the Direction in the pull-down in the diagram header.

The red colored pin indicating the source of the lineage and impact trace.
The diagram defaults to the classifier (table) level for performance reasons.
Click the Show actions for the selected object icon and select Show Columns.

Now columns are visible, but still not the column lines. Again, this is for reasons of performance and simplicity of presentation.
Click on the Display Options icon and click Show Conditional Labels

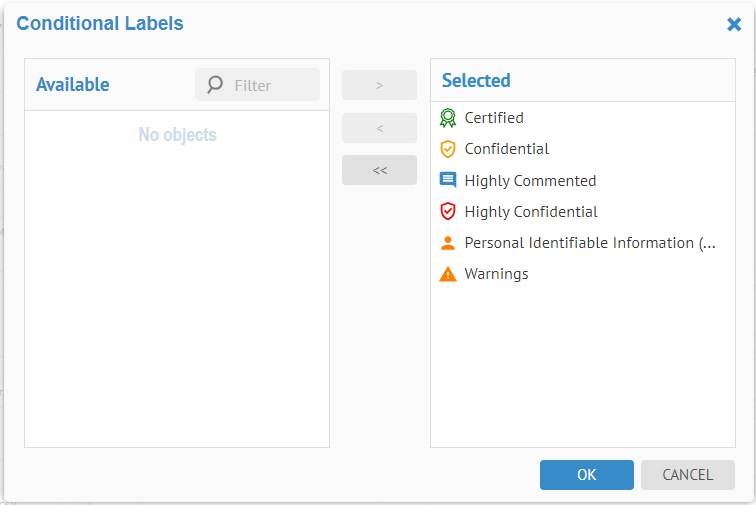
Here, you may pick and choose conditional labels to show in the diagram and the image shows all of them selected for display.
Click on the Display Options icon and select Show Term Definitions
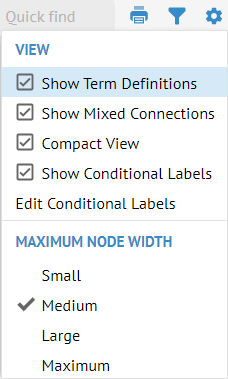
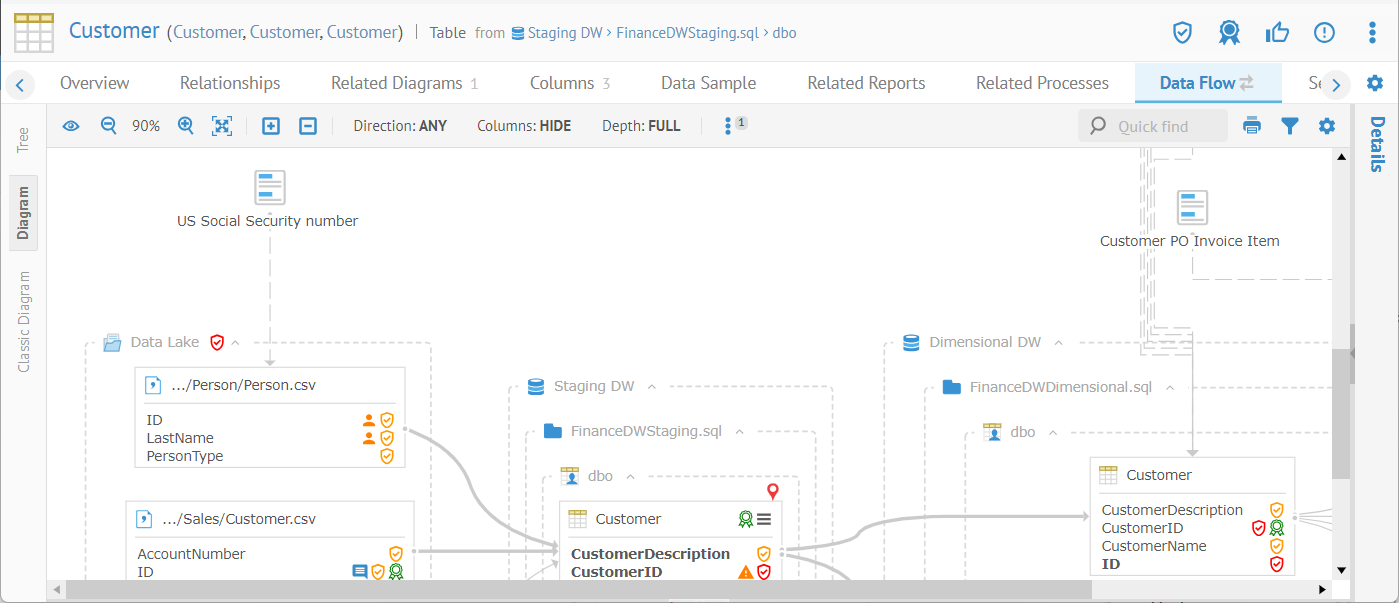
Terms, like US Social Security Number (documenting the ID field), are used to document columns and tables that are in this lineage trace and this is shown in the diagram.
Data Lineage Diagram Display Options
You may control the display of lineage objects and their presentation using the lineage  Display Options menu.

Here you may see the terms with Defined by relationships.
Show/Hide Columns

Click on the Display Options icon and click Show Conditional Labels
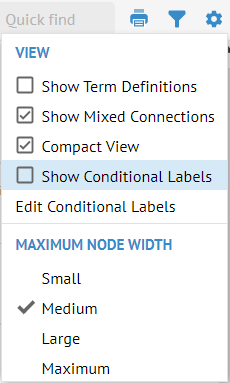

Here, you may pick and choose conditional labels to show in the diagram and the image shows all of them selected for display.

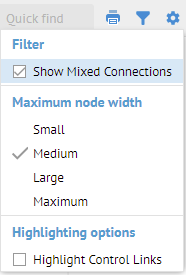
Show Mixed Connections
See Show Mixed Connections in the Classic Data Lineage Diagram.
Maximum Node Width
See Maximum Note Width in the Data Lineage Diagram.
Lineage Diagram Trace in General
Select the Analysis Diagram tab on the left to obtain this presentation. You will see a graphical presentation of the lineage (data impact or data source).
Additional options include:
Overview
You may click this icon to show or hide an Overview panel of the lineage trace diagram. Click in the overview to quickly move to a portion of the full diagram.

Zoom In/Out and Fit to content
Click Zoom in or Zoom out icons to adjust the aspect ratio of the diagram. Also, you may click on the Fit to content icon to view the entire diagram at the best zoom that will fit.

Collapse / Expand

Click Expand / Collapse to expand or collapse the entire diagram (ensure that you do not have an object selected, otherwise the action will only apply to that object).
You may also click on the plus sign for an object to expand and the minus sign to collapse just that object.
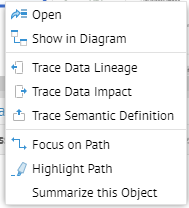
Open the object page

You may right-click and select Open ( ),to navigate to the object page.

You may download a PNG or SVG image of the diagram.
Quick find

In the upper right, there is a search text box that will provide a quick list of object names that contain the text you type. You may click on any of the results to select that object in the diagram and moving the focus there.
Explore Further
Invoking a lineage trace from any reference to a object
You may invoke a lineage trace from any diagram or any list of results (e.g., from a Browse or Search), either via right-click context menu
Interpreting the graphical lineage
In general, the lineage tools within Talend Data Catalog function identically whether one is analyzing data flow lineage, semantic lineage or both. However, the presentation is different, as follows:
In addition, Talend Data Catalog has four levels of presentation:
- Configuration Model Connections Overview – which is a diagram representing the various Models contained within a configuration and how they are related (or stitched) to each other based upon connection definitions manually assigned to Talend Data Catalog .
- Model Connections Overview – which is a diagram representing the various Models contained within the directory of an external repository and how they are related (or stitched) to each other based upon connection definitions already provided in the external metadata repository.
- Model Lineage Overview – which is a diagram representing an overview of the lineage within a given Model.
- Lineage Trace analysis at the configuration or Model level – which is a fully detailed trace of semantic and/or data flow lineage for detailed analysis.
Properties Panel
Click to select a object and view its properties in the Properties Panel on the right. You may show and hide this panel as needed.
Data Flow Classic Diagram
This method of analysis presents a graphical representation of the flow of data through connection definitions to data stores and physical transformation rules which transform and move the data. To see data flow lineage, one must
- Define a configuration that contains all of the models potentially in the data flow
- Stitch the models together by resolving connection definitions and Build the configuration
Once the configuration is ready, then you are ready to report on lineage.
End-to-end data flow lineage across models is only available at the classifier (e.g., table) and feature (e.g., column) level. If instead, one goes to the object page for a schema or model, , as this is not classifier or feature, the data flow tab shows the overview lineage within the scope of that model only.
This is an older methodology for presenting a lineage trace. You are highly encouraged to us the newer Data Flow Diagram method as the Classic diagram does not scale well with larger diagrams and number of objects.
You may disable this feature in the UI by setting the Show Lineage Classic Diagram in group preference to false for the group Everyone.
These are the analysis type use cases, generally posed as questions such as:
- Given an item on a report, what data entry system fields impact these results?
- Why are the numbers on this report the way that they are?
- How to change the system data to get the correct results for this report?
This type of analysis, i.e., asking where the information comes from, is a question posed “upstream” in the dataflow. We refer to it as a reverse lineage question. When consumers of these reports ask these questions, a correct and responsive answer may be the most valuable information provided by a metadata management environment.
Steps
- Trace data flow lineage.
- Click the Diagram tab on the left.
- From here you may
- Pick the Type in the pull-down in the upper right.
- Data Impact type
- Data Lineage type
- Full Data Lineage type for both data impact and lineage.
- Click the More Options icon and
- select Show/Hide Columns to show columns in the selected object, or all objects if none is selected
- select Expand/Collapse All to expand down to the current display level (columns or tables) or collapse to the highest level.
- Click Save an image to produce a downloadable file with a lineage image
- Click Edit Filters and specify lineage filter options.
- Click Display Options and specify lineage display options.
Example
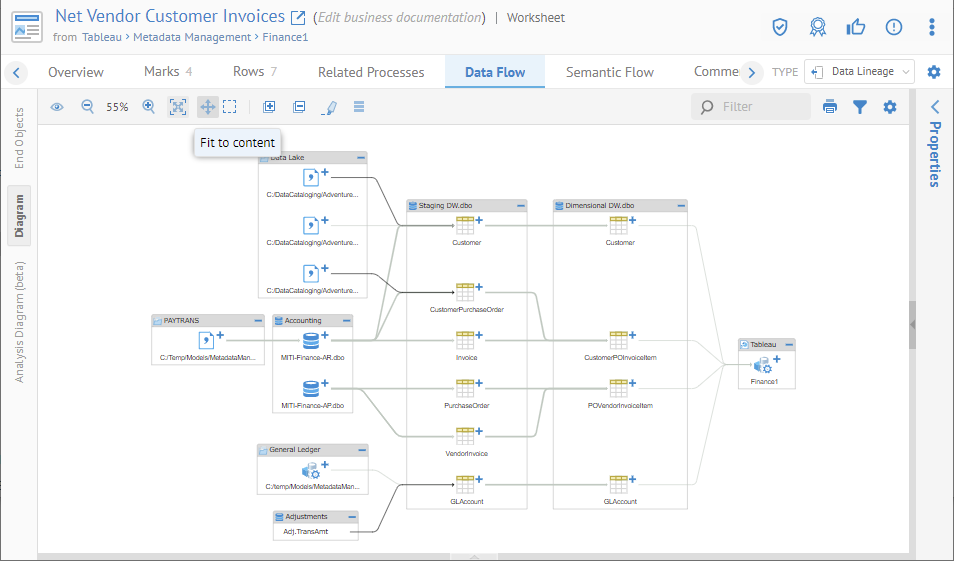
Search for the Net Vendor CustomerInvoices Tableau worksheet and open it.
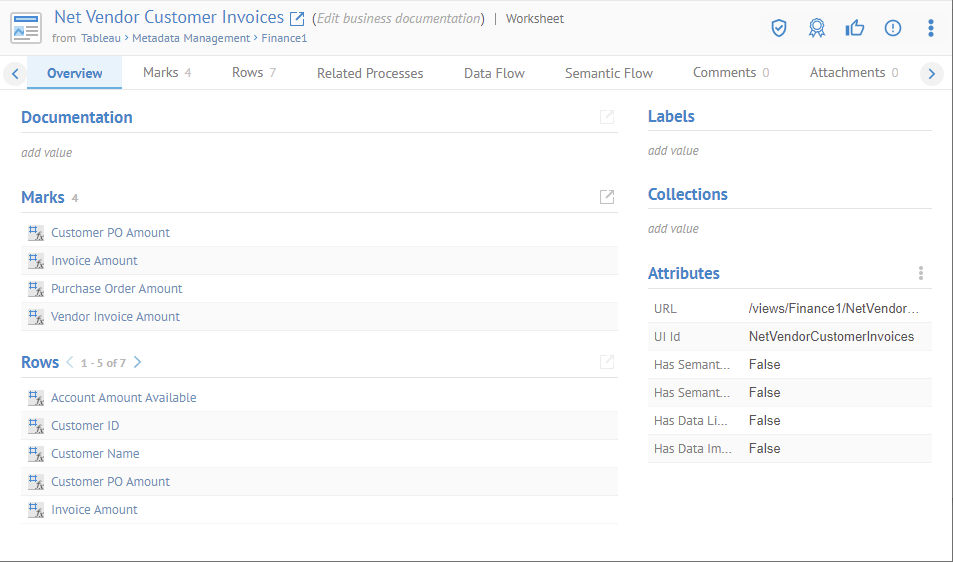
Go to the Data Flow tab.
This is a business intelligence report and thus is at the end of the lineage, so Talend Data Catalog automatically chooses Data Lineage for lineage Type.
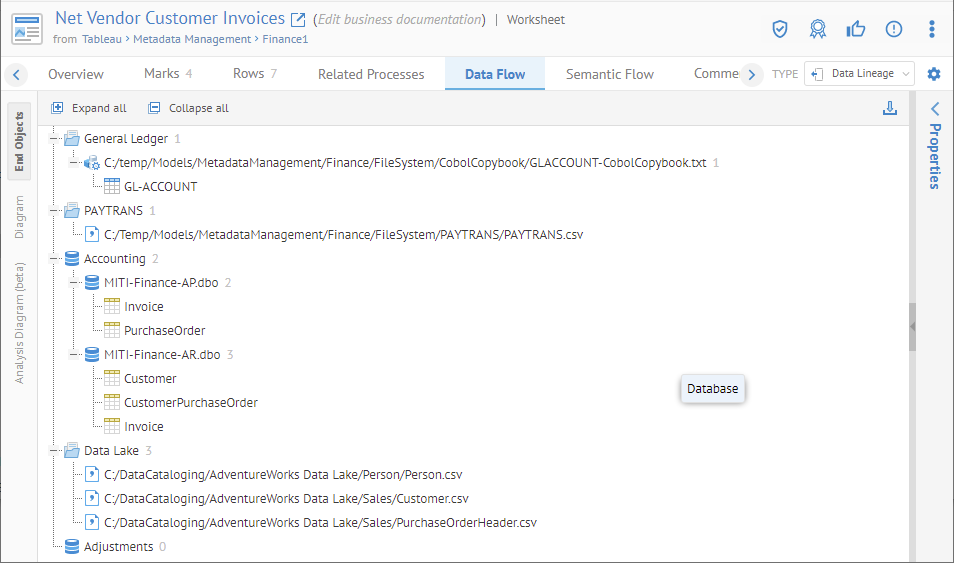
The End Objects tab on the left is selected in this case, so we see the textual tree-based report.
Click Collapse all to reduce the tree to the top five elements in the lineage.

Now, click the Diagram tab on the left. Click the Collapse Selected node completely ( ) icon.
The different lineage indicate different types of data flow processes
Click the plus sign next to MITI-Finance-AP.dbo (Database) in Accounting (Model).
Click the plus sign next to Invoice (Table) in MITI-Finance-AP.dbo (Database).

You then see the exact column that is a source in the lineage trace.
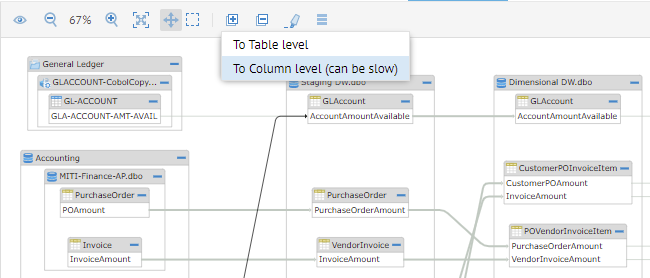
Click in an empty space in the diagram to de-select Invoice, then select the To Column level expansion, which will now apply to all objects.
Select a column, then click Highlight to outline the paths through that object.

Click the black line between Adjustments.Adj.TransAmt and Staging DW.dbo.GLAccount. AccountAmountAvailable.
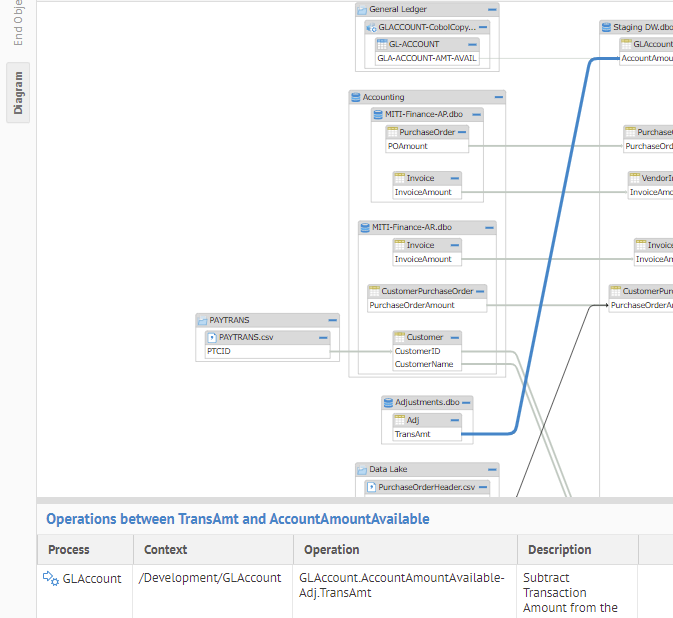
And you see the transformation at the bottom of the page.
You may also simply pass the pointer over a link and see summary information.
Many times, one may ask these forward lineage or impact analysis type of questions:
- If I make a change to this field, what reports will be impacted?
- How is this identity information merged with the personnel system information on these other reports?
A data flow impact report traces the manner in which data flows from source to destination.
Steps
- Trace data flow lineage.
- Click Data Impact in the Type pull-down in the upper right.
- From here you may
- Pick the Type in the pull-down in the upper right.
- Data Impact type
- Data Lineage type
- Full Data Lineage type for both data impact and lineage.
- Click the More Options icon and
- select Show/Hide Columns to show columns in the selected object, or all objects if none is selected
- select Expand/Collapse All to expand down to the current display level (columns or tables) or collapse to the highest level.
- Click Save an image to produce a downloadable file with a lineage image
- Click Edit Filters and specify lineage filter options.
- Click Display Options and specify lineage display options.
Example
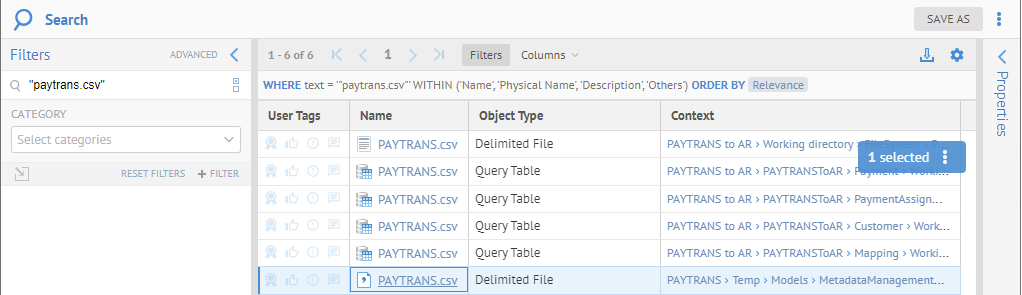
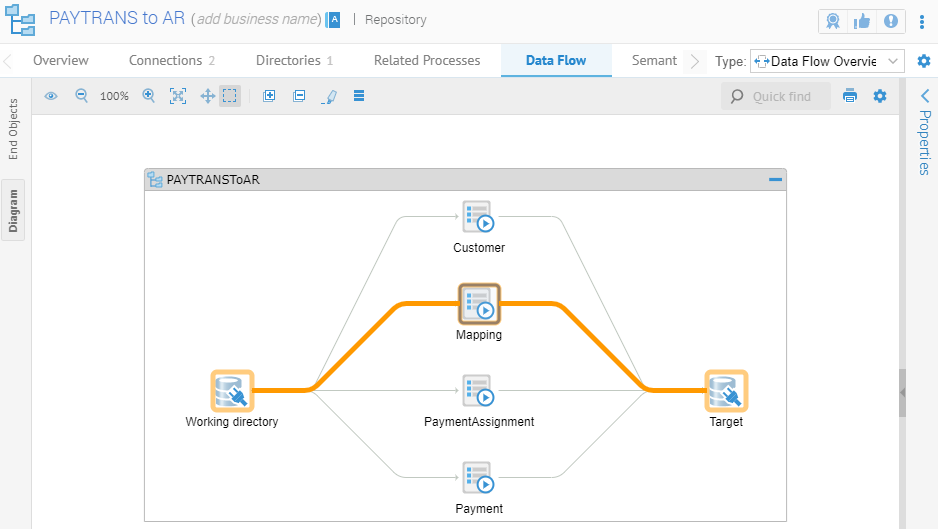
Navigate to the object page for the file PAYTRANS.csv (a search string must be enclosed in quotation marks as the period (.) has special meaning in the search syntax, e.g. "PAYTRANS.csv") and the semantic search must be disabled.
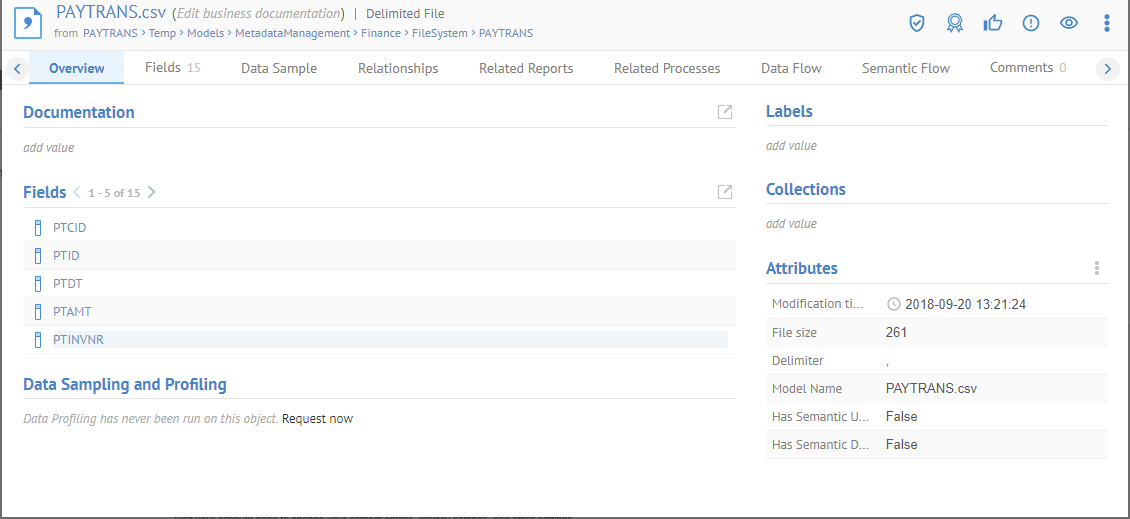
Then click the Data Flow tab and Diagram tab on the left. Note, the Impact type is automatically selected, as the PAYTRANS.csv file is an ultimate source in the configuration, so it does not have any source lineage.

This option provides the combination of both:
- Data Lineage (trace from an object upstream to objects that provide data flow to that object)
- Data Impact (trace from an object downstream to objects that are impacted via data flow by that object)
Based upon all the lineage flows that trace though the selected object (feature or classifier).
Steps
- Trace data flow lineage.
- Click Full Data Lineage in the Type pull-down in the upper right.
- From here you may
- Pick the Type in the pull-down in the upper right.
- Data Impact type
- Data Lineage type
- Full Data Lineage type for both data impact and lineage.
- Click the More Options icon and
- select Show/Hide Columns to show columns in the selected object, or all objects if none is selected
- select Expand/Collapse All to expand down to the current display level (columns or tables) or collapse to the highest level.
- Click Save an image to produce a downloadable file with a lineage image
- Click Edit Filters and specify lineage filter options.
- Click Display Options and specify lineage display options.
Example
The Full Data Lineage option is the default. However, as it may take more time to render, you may disable it in the Group Preferences.
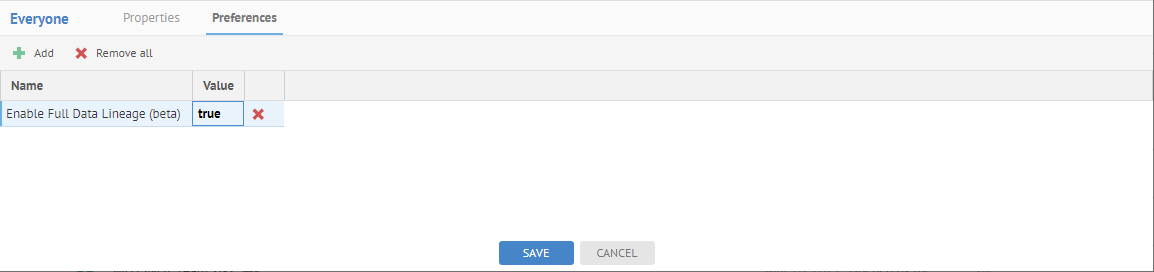
If disable, you may enable it. Sign in as Administrator. Go to MANAGE > Groups. Select the group named Everyone. Go to the Preferences tab and click Add and specify the Enable Full Data Lineage preference.

Click OK. Set the Value to true and click SAVE.
Search for “Customer” and pick the table Dimensional DW > dbo > Customer.

Go to the Data Flow tab.
The Data flow tab has double arrows next to it, indicating that there are both impact and lineage traces for this object.
Select Full Data Lineage.
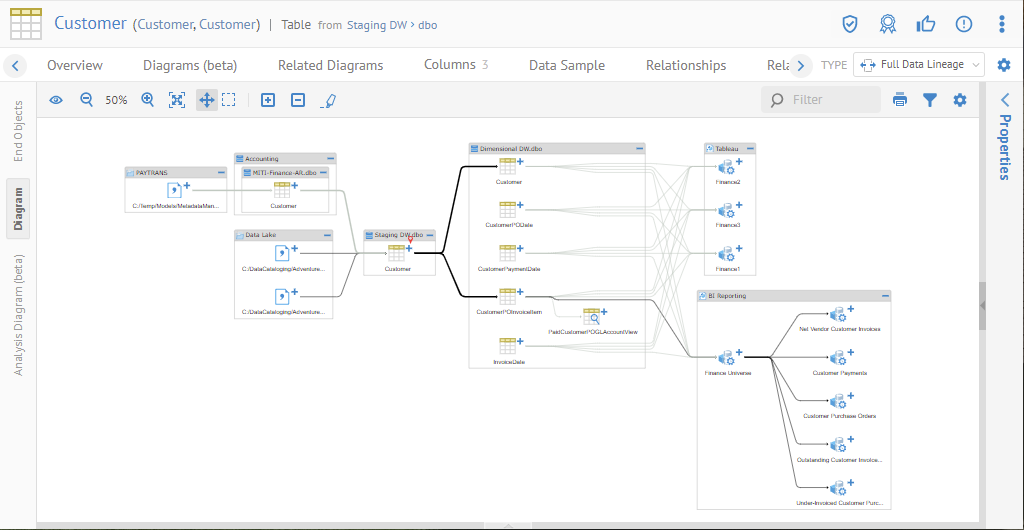
You have all the lineage traces going through that object. The object from which the lineage is determined is marked with a red pin.
Data Lineage Diagram Display Options
You may control the display of lineage objects and their presentation using the lineage  Display Options menu.
Sometimes an ETL/DI process will read from one table and write to another table in the same database. In this case, the lineage will often show process arrows that loop back because the normal presentation is to group tables inside their respective schemas. However, by default, the lineage in the Data Flow tab will attempt to produce a continuous diagram from left to right through the lineage by breaking up these tables giving a more understandable lineage picture.

When you click this checkbox the lineage is returned to the mode where all tables are grouped into their respective schemas and thus loops are shown.

Steps
The default setting where this option is not checked is presented.
- Check
 Display Options > Show Mixed Connections to show these objects
The lineage is returned to the mode where all tables are grouped into their respective schemas and thus loops are shown
- You may uncheck to return to the default.
In many cases, names of objects may be too long to fit into the objects in the diagram. You may specify several different node width maximums to make the diagram more readable. Click on Display Options.

Highlight Control Links
Checking this option means that anytime you are highlighting a trace, the control links will be included in the highlighting.
Lineage Diagram Trace in General
Select the Diagram tab on the left to obtain this presentation. You will see a graphical presentation of the lineage (data impact or data source) with round edges boxes representing nodes, many contained within larger boxes (container structures, e.g., a schema contains several tables). Then, connecting lines denote the lineage flow. In general, the lineage tools within Talend Data Catalog function identically whether one is analyzing data flow lineage, semantic lineage or both. However, the presentation is different, as follows:
Overview
You may click this icon to show or hide an Overview panel of the lineage trace diagram. Click in the overview to quickly move to a portion of the full diagram.

Zoom In/Out and Fit to content
Click Zoom in or Zoom out icons to adjust the aspect ratio of the diagram. Also, you may click on the Fit to content icon to view the entire diagram at the best zoom that will fit.

Collapse / Expand

Click Expand icons to expand the entire diagram (ensure that you do not have an object selected, otherwise the action will only apply to that object).
Click on Collapse collapse all objects to the highest level.
You may also click on the plus sign for an object to expand and the minus sign to collapse just that object.
Highlight

Click to select an object in the trace and then click the Highlight ( ) icon to highlight the path through that selected object.
You may double-click or perform a long click on the Highlight icon to lock it in place and the path will highlight for any subsequently selected object.
Focus the lineage trace

You may focus the lineage trace to only include that portion of the trace that passes through another object in the diagram. Click to select an object, click  More Actions and click on the Only show the selected node ancestors and descendants icon (
 ).
).

To remove the focus and return to the entire lineage diagram simply click to close the dialog stating “Currently focusing on…”
Open the object page

You may double-click, right-click and select Open ( ), or select the object and use the Open icon to navigate to the object page.
With the newer Diagram lineage, easier is to simply expand the Details panel.
Trace lineage from another object

You may re-trace the lineage from any object in the diagram. Select the object and use the Trace Lineage icon ( ) to restart the trace from that point with that type of trace.

You may download a PNG or SVG image of the diagram.
Quick find

In the upper right, there is a search text box that will provide a quick list of object names that contain the text you type. You may click on any of the results to select that object in the diagram and moving the focus there.
Explore Further
Invoking a lineage trace from any reference to a object
You may invoke a lineage trace from any diagram or any list of results (e.g., from a Browse or Search), either via right-click context menu

Interpreting the graphical lineage
In general, the lineage tools within Talend Data Catalog function identically whether one is analyzing data flow lineage, semantic lineage or both. However, the presentation is different, as follows:
In addition, Talend Data Catalog has four levels of presentation:
- Configuration Model Connections Overview – which is a diagram representing the various Models contained within a configuration and how they are related (or stitched) to each other based upon connection definitions manually assigned to Talend Data Catalog .
- Model Connections Overview – which is a diagram representing the various Models contained within the directory of an external repository and how they are related (or stitched) to each other based upon connection definitions already provided in the external metadata repository.
- Model Lineage Overview – which is a diagram representing an overview of the lineage within a given Model.
- Lineage Trace analysis at the configuration or Model level – which is a fully detailed trace of semantic and/or data flow lineage for detailed analysis.
Properties Panel
Click to select a object and view its properties in the Properties Panel on the right. You may show and hide this panel as needed.
Data Flow Overview for Models
Data Integration and ETL/ETL data processes contain lineage within the model, even without stitching them to other models. In addition, data store models such as databases with views and/or stored procedures also present lineage in this fashion.
You may even use the lineage overview on models not in the current configuration using the MANAGE > Repository function.
The Data Flow Overview lineage (see TYPE in the upper right of diagram) has a very limited scope, only to the specific subset that is a self-contained model, e.g., a schema model in a database model or a transformation model or connection model in an ETL/DI model or BI model. Thus, it has none of the information determined in an Impact or Lineage trace diagram, so that connections are not resolved (may just be a * because of “Select *” in the connection definition). To get a true lineage picture you must use the Impact or Lineage trace from a table or column (field).
In addition, in the Overview lineage of a connection model in an ETL/DI model or BI model, many of the object are not even included in an end-to-end lineage trace and thus you will not be able to trace from that object at all. This limitation is caused by the fact that connection definitions themselves only show in the overview and are not a part of a lineage trace and thus there is no way to trace lineage from them.
The data flow overview lineage presents detailed transformation lineage vs. a lineage trace which presents summary lineage.
In particular, when you select a runtime job, and go to the data flow tab, you see the detailed transformation lineage: every transformation is being depicted on the screen. This view is good as long as you only look at one job at a time.
Finally, the Data Flow presentation for overview lineage does notoffer the Tree tab as the scope is only the currently model and the Tree tab features end-to-end lineage, which is not available for overview lineage presentations.
Steps
- Sign in as a user which has at least the Metadata Viewing or Data Managementcapability object role assignment to the model to be analyzed for Overview lineage.
- Open the object page of the model (e.g., ETL/DI or BI model)
- Go to the Data Flow tab.
Example
Sign in as Administrator and go to the object page for the Staging to Dimensional Talend DI model and go to the Data Flow tab.
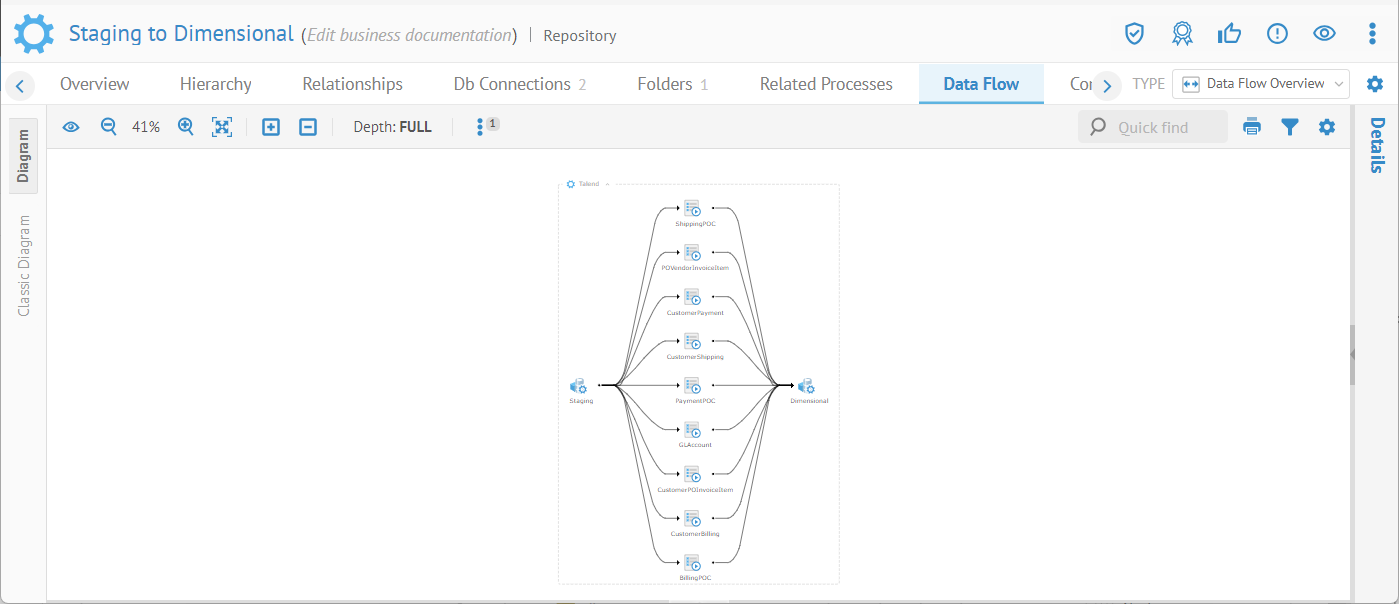
Right-click on the top DI process name ShippingPOC and select Open.

Data Flow Lineage Trace in General
A lineage trace will always have a point of origin, and also has a Type or direction. For the Data Flow lineage tab,
there are a number of common features and tools available when visualizing a lineage trace. Reporting on lineage will bring you to the Lineage Trace Page.
First, though, you must choose to see the Diagram or the End Object (list view), by clicking the tabs on the left.
Data Flow Options
Many options are available in the menus of a data flow lineage report.
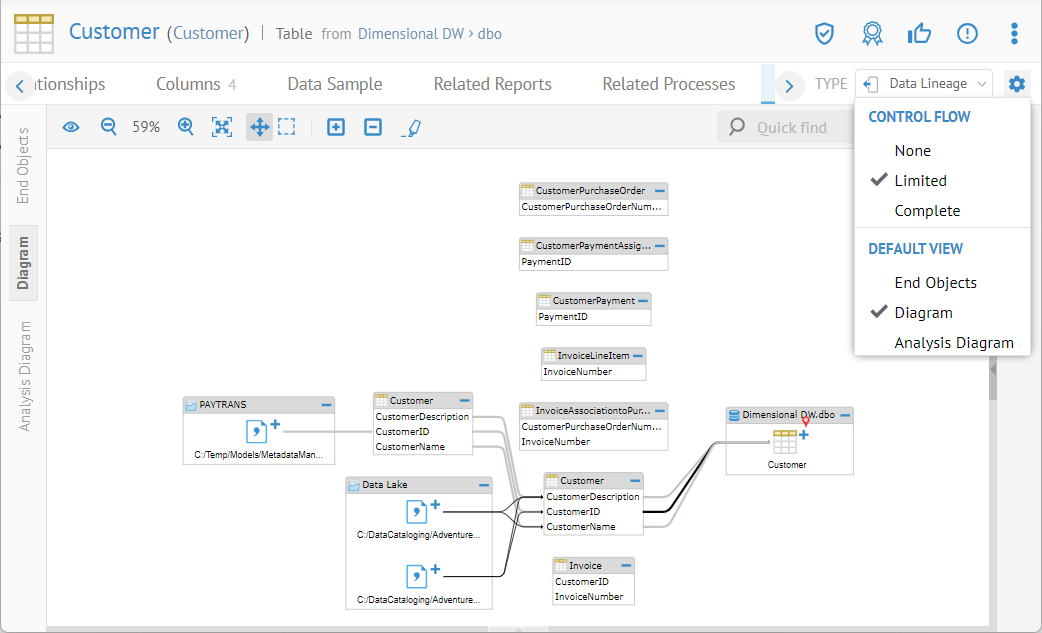
Control Flow
Control flow is lineage that traces from an object used as part of a selection WHERE clause or similar structure that impacts what data is moved but is not itself directly moved to the target. There are two types of control flow:
- Column control flow where the control flow directly impacts values of column (e.g., lookup)
- Row control flow where the control flow does not directly impact values of columns (e.g., filters).
It is easy to imagine a common scenario where you trace data impact and your impact trace affects a commonly used (in terms of joins and WHERE clauses) dimension, e.g., the time dimension in the warehouse, mart or otherwise. Just about every report will be using that dimension in some way, and thus the impact lineage is basically everything. In this case the diagram size quickly grows out of the capability of your browser to present the lineage let alone navigate and analyze it.
For this and other similar reasons, the same menu as above includes options to limit the lineage.
Talend Data Catalog may be used as an active data catalog, providing:
Control Lineage Option | Description | Delay in Presentation |
None | No control flow data impacts are traced | None |
Limited | Limited control flow data impacts are traced | Maybe slow |
Complete | All control flow data impacts are traced | Likely slow |
Steps
- Begin a lineage trace.
- In Data Flow Settings, you may:
- Click Data Flow Settings >Control Flow/None to hide any object which are only connected via control flow and not show any control flow links.
- Click Data Flow Settings >Control Flow/Limited to show any objects which are directly connected to the origin object via control flow and show those control flow links.
- Click Data Flow Settings >Control Flow/Complete to show any objects which are connected via control flow to the origin object and any subsequent objects and show those control flow links.
- Once control flow display is enabled, then go to the lineage Diagram and click on target elements and the control flow that the target depends upon will appear.
- Trace data flow lineage.
- Click Data Impact in the Type pull-down in the upper right.
Example
Search for the Dimensional DW.dbo.Customer table and open it.
Go to the Data Flow tab and ensure that the Type is Data Lineage and the View is Diagram.

There is a red “pin” in the diagram, showing the point of origin, from which lineage is presented. In this case, the Customer table.
Finally, ensure that the  Display Options are all unchecked, and
  Data Flow Settings are None and the Lineage Filters are all No:


End Objects gives:

Return to the Diagram view and select Dimensional DW.dbo.Customer.CustomerID and expand the Details at the right.
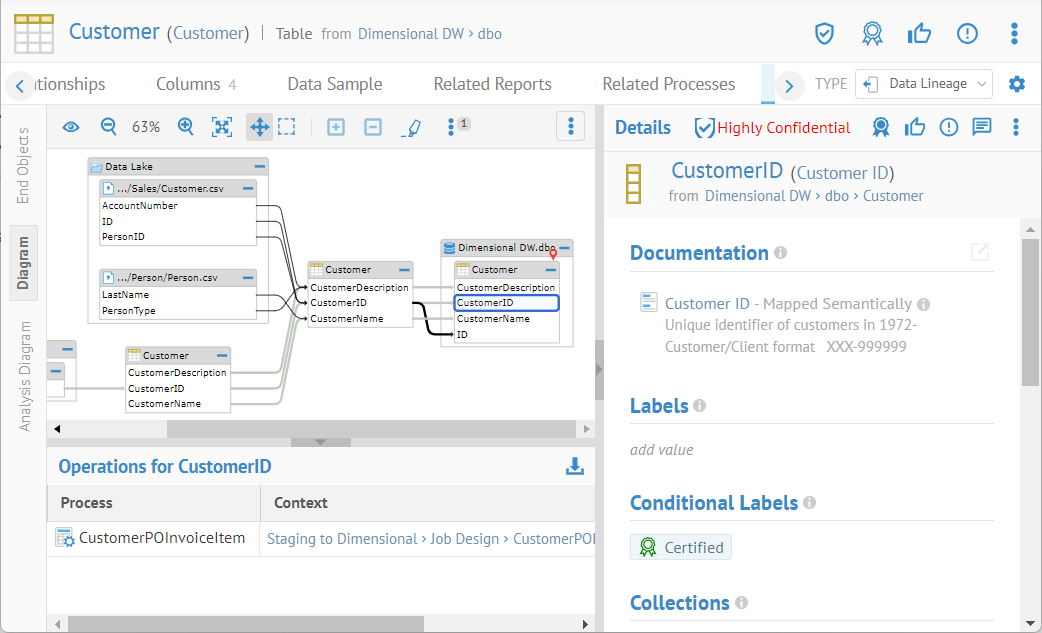
At this time, the diagram does not contain any control lineage artifacts, as we specified.
Now, update the  Data Flow Settings with Control Flow as Limited:
Many new objects, which are not directly connected by data flow links now appear. Selecting Data Flow Settings >Control Flow > Limited shows any objects which are directly connected to the origin object via control flow.
One must click on an object to see the control lineage.
Now, expand Customer and again click the Dimensional DW.dbo.Customer.CustomerID column.
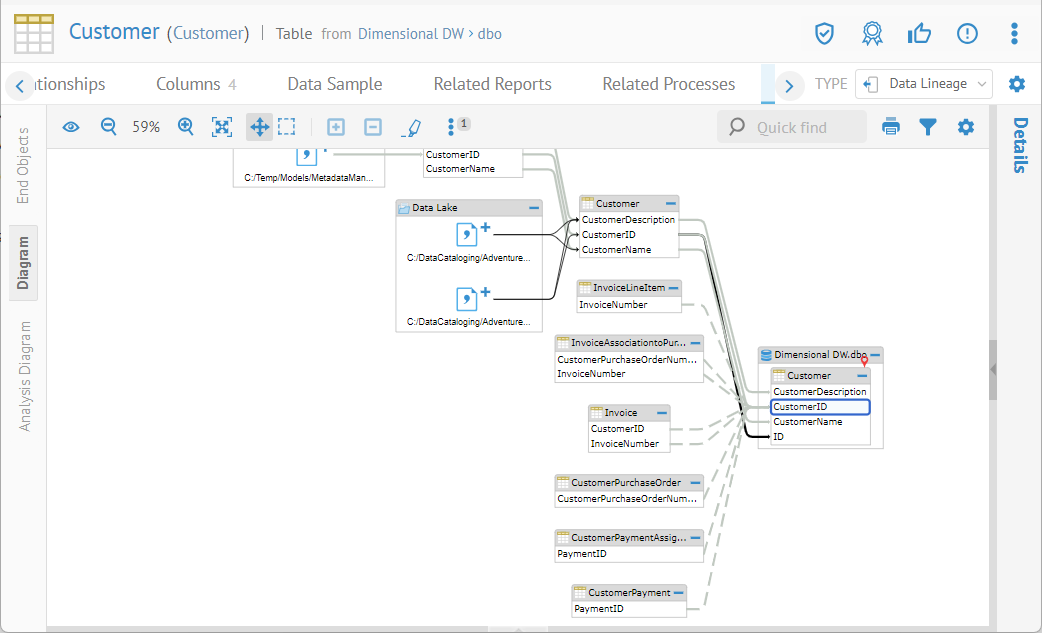
And we see control lineage as different (dashed) lines.
Now, update the  Data Flow settings with Control Flow as Complete:
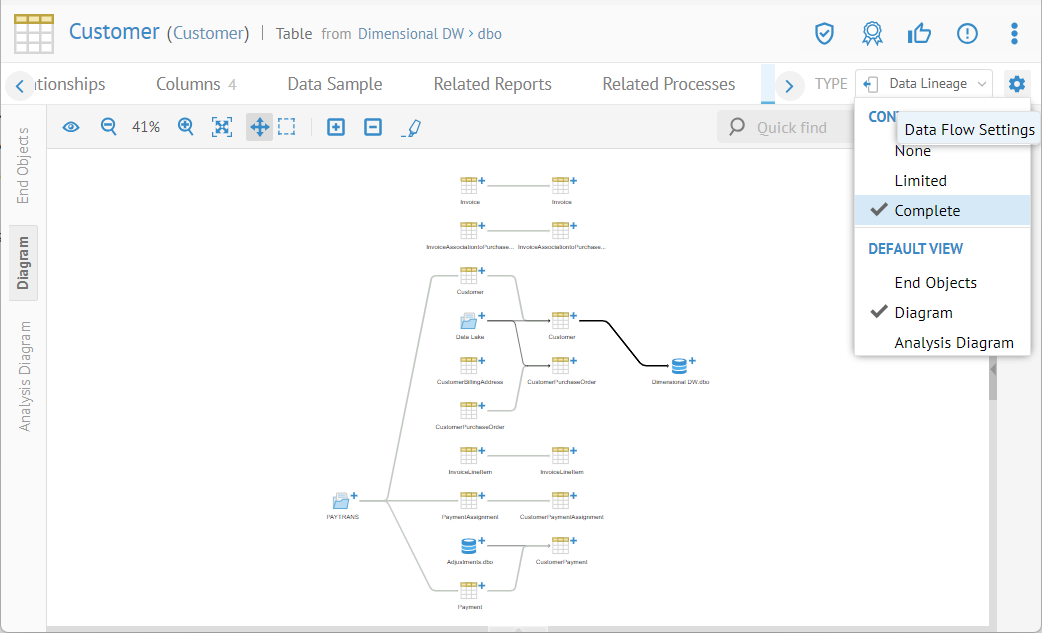
Even more objects are now shown in the lineage diagram but are unconnected. Again, one must click on an object to see the control lineage.
Then select Show Mixed Connections from the Display Options menu.

Expand Staging DW.dbo.CustomerPayment and select PaymentID.

Many new objects, which are not directly connected by data flow links now appear. Selecting Data Flow Settings >Control Flow > Complete shows any objects which are connected via control flow to the origin object and any subsequent objects.
One may include or filter out various object types in order to focus only on specific types of objects in the lineage.

Click Edit Filters and specify:
- SHOW TEMPORARY OBJECTS to show intermediate temporary tables/columns in the lineage
- SHOW INTERNAL OBJECTS to show any intermediate schemas/tables/columns between connections in the lineage
- SHOW EXTERNAL OBJECTS to show any external source tables or files which an object in the lineage from which the object is derived
- SHOW EXTERNAL TABLE LOCATION OBJECTS to include objects which are only external table locations that require connection resolution.
- EXCLUDE MODEL TYPES to not show specific types of models in the lineage
- EXCLUDE MODELS to not show specifically selected models.
- DEPTH to allow a specific number for the depth into objects in the lineage trace.
In some cases you may see that a lineage diagram is taking an excessive amount of time to display or that you are presented with the message:
This large diagram has xxxxx objects and xxxxx links which may require more resources that what your browse case handle.
You may use the PROCEED ANYWAY button to try to visualize the diagram.
You may also save these settings as defaults in future lineage traces.
Steps
- Begin a lineage trace.
- Click Edit Filters and specify:
- SHOW TEMPORARY OBJECTS to show intermediate temporary tables/columns in the lineage
- SHOW INTERNAL OBJECTS to show any intermediate schemas/tables/columns between connections in the lineage
- SHOW EXTERNAL OBJECTS to show any external source tables or files which an object in the lineage from which the object is derived
- SHOW EXTERNAL TABLE LOCATION OBJECTS to include objects which are only external table locations that require connection resolution.
- EXCLUDE MODEL TYPES to not show specific types of models in the lineage
- EXCLUDE MODELS to not show specifically selected models.
- DEPTH to allow a specific number for the depth into objects in the lineage trace.
Show Internal/External Objects
Lineage reporting may
- either Show Internal Objects within a model (e.g., interim steps in transformations) or just the objects stitched to other model objects.
- either Show External Objects that are not directly material to the lineage trace (such as the link from files in HDSF to the tables representing them in Hive) or not show these objects.
Show Temporary Objects
Big data solutions and other ETL/DI processes use temporary files and tables routinely. When harvesting, Talend Data Catalog detects temporary files and marks them as TEMPORARY in their lineage characteristics. This fact means that you can distinguish temporary objects from permanent/stitchable ones in a lineage diagram and, optionally hide/show them.
Show External Table Location Objects
Models may refer to external tables that require connection resolution. By default, these table location objects are not shown. You may use this option to explicitly show them.
Default View
This option allows you to save the current filter setting to be the default for future trace reports.
Did this page help you?
If you find any issues with this page or its content – a typo, a missing step, or a technical error – let us know how we can improve!